|
|
|
Proventia A Series intrusion detection appliances are designed to detect malicious attacks as they enter the network, including denial of service, intrusions and malicious code, backdoors and hybrid threats like MS Blaster, SQL Slammer, Nimda and Code Red. � Built upon the Proventia code base, the A604 appliance features a pre-installed network agent on a standard Intel platform. The device features two 10/100/1000Mbps ports for management and for sending TCP Resets, and two 100/1000Mbps copper ports for monitoring up to two segments.� The Proventia A604 is designed to support up to 600Mbps bandwidth and offers outstanding performance, easily matching its rated throughput. We also found the A604 to be to be very stable and reliable, coping with our extensive reliability tests with ease and without succumbing to common evasion techniques. � The SiteProtector management system has been well designed to handle management and configuration of large numbers of IPS and IDS sensors across the enterprise. Alert handling is powerful and flexible, especially when combined with the optional SiteProtector SecurityFusion module. The Internet Security Systems appliance-based IPS offering consists of the following components:� The Proventia A604 appliance is a 1U rack mount server chassis based on a standard Intel platform. Details of the processor and memory configuration are not available, but they are designed to accommodate the rated bandwidth of the appliance (600Mbps in this case). � The device includes redundant internal cooling fans (not hot-swappable), a single power supply and a single disk for data storage. There are two built-in copper 10/100/1000Mbps ports on the rear panel, one used as the management interface, and the other dedicated to sending TCP Reset/Kills. Two more copper 10/100/1000Mbps ports (on a dual-port card) are provided for monitoring two separate segments if required.� The Proventia A604 uses the Linux-based Proventia detection engine together with a custom driver specially built for Proventia hardware. The system is hardened and completely locked down so that the only way it can be accessed is from SiteProtector or SSH (or directly at the appliance via keyboard and monitor). The older Workgroup Manager console is no longer supported with Proventia.� The system is designed to provide all initial configuration functions - such as IP address assignment,�management console assignment, and password change - via a simple text-based local interface to which the administrator is restricted following login.� It is also possible to configure network settings for the management interface, set date and time, admin password, TCP Reset/Kill parameters, and reboot or shut down the appliance via this menu. All other day-to-day administrative tasks, such as policy changes,�can be accomplished via the SiteProtector manager installed nearby or at a remote location.� The Proventia Linux-based sensor software (which ISS refers to as an Agent) runs on the Proventia hardware in order to monitor a network segment, analyse the traffic flow and look for intrusions and signs of network abuse. � When an intrusion is detected, Proventia can respond in a number of ways, including:�
Proventia understands over 100 network and application layer protocols such as HTTP, FTP, SMTP, SNMP, RPC, SMB, NetBIOS as well as many Trojan communication protocols. Over 150 protocols are understood, if not completely decoded.� Proventia’s protocol analysis capabilities do not rely on merely checking for textbook (RFC) compliance since anomalies are difficult (and sometimes impossible) to define due to RFC ambiguities and differences in interpretation of the standards. Instead, Proventia focuses on analysing protocols to recognise context and then employs pattern matching techniques where appropriate to positively identify malicious content. � In addition, Proventia can also perform full IP packet de-fragmentation, as well as TCP and HTTP session reassembly (tracking over 1 million simultaneous sessions out of the box), and is immune to well-known evasion techniques such as polymorphic shell code mutation, Unicode URL encoding, packet overlapping and RPC record fragging. � Event consolidation logic helps to reduce the total number of unique events that the sensor generates by logically combining large numbers of identical events into a single alert. Proventia listens to both the transmitting and receiving data streams which allows it to capture server responses for many attacks, such as HTTP, FTP, RPC and DNS events. The ability to report return codes and other server-side responses to the alert console helps guide security operators to quickly recognise the outcome of an attack, and is thus an important tool for prioritising incident response. Proventia has very strong signature coverage.�In addition to the Proventia protocol analysis module, now referred to as the Protection Engine, Proventia, like RealSecure, has the ability to import most of the published rules from Snort, via the aptly named Trons module. The aim of this is not to replace Snort, nor is it to enable sites to include the entire Snort signature set (which would seriously impact the performance of Proventia), but to allow users to write their own custom signatures using a relatively simple rules definition language that is familiar to many in the security industry.�
SiteProtector provides a central console geared towards large scale enterprise management and event correlation across multiple network, server, desktop, and assessment agents. � Features include:�
The Deployment Manager can be used to install all of the SiteProtector components from a centralised computer anywhere on the network. Once the Deployment Manager has been installed on one PC, the CD is no longer required to install either SiteProtector itself, or any of the other components of a Proventia system. Instead, a simple Web-based installation capability is provided which can be accessed from any host on the network. �
The Deployment Manager can be used to install the Basic or Custom SiteProtector installation, in addition to the following components: �
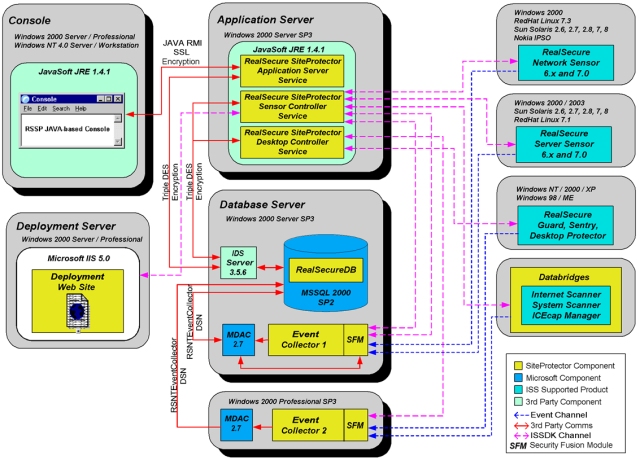
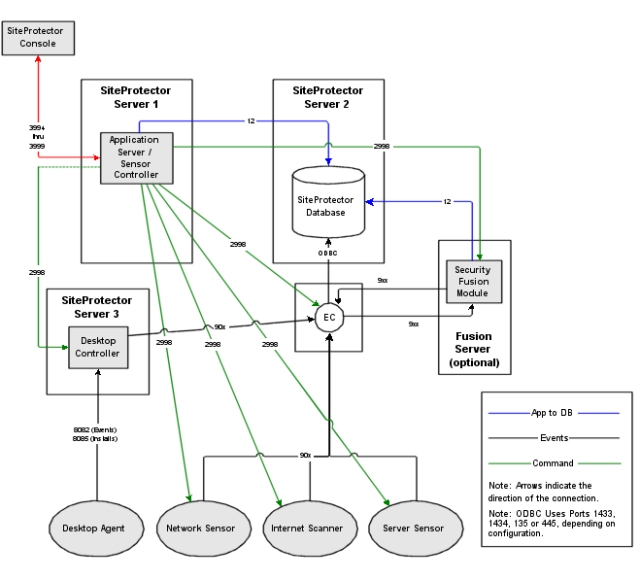
The Application Server enables communication between the SiteProtector Console and the Proventia Site database. The Sensor Controller sends commands to the sensors, such as the command to start or stop collecting events. The Sensor Controller and the Application Server are installed on the same host.� The Proventia Site Database stores the data that the Event Collector collects from sensors. This is based on Microsoft SQL Server for large deployments, or MSDE for smaller installations. The Event Collector pulls data from sensors and stores the data in the database. Typically only one Event Collector is installed on a SiteProtector Site, but up to five Event Collectors can be installed per Site when required for performance reasons. The latest release adds failover capability between Event Collectors, such that if one fails another will assume its role. SiteProtector SecurityFusion Module The SiteProtector SecurityFusion module is an optional (extra-cost) module that correlates data from multiple sources, sources, including Proventia, RealSecure Network and�Server agents, and Internet Scanner or�System Scanner instances. This automated correlation escalates critical attacks and reduces false alarms.� The Console is the graphical user interface (GUI) for the SiteProtector installation. With the Console, the administrator can perform a variety of activities, such as monitoring events and scheduling scans. The specific tasks that can be performed using the SiteProtector Console depends on role assigned to the administrator.� The fully Java-based Site Protector Console included with earlier releases has now been replaced by a Java plug-in to Internet Explorer, providing an increase in performance. Deployment is also easier, since it is no longer necessary to download the Console from the Deployment Manager.� � One of the biggest advantages of the Java-based approach rather than the C++ code of the old Workgroup Manager is the ability to spawn multiple windows within the same Console, each performing a different task. So while that large report is loading, it is still possible to be defining and deploying a new policy. � The aim of this section is to verify that the sensor is capable of detecting and logging exploits when subjected to increasing loads of background traffic up to the maximum bandwidth supported as claimed by the vendor. � For each type of background traffic, we also determine the maximum load the sensor can sustain before it begins to drop packets/miss alerts. The Proventia A604 was tested up to 600Mbps, the rated speed of the appliance. Performance at all levels of our load tests was impeccable, with 100 per cent of all attacks being detected under all load conditions. We would thus have no hesitation in rating the Proventia A604 as a true 600Mbps IDS device as claimed by ISS.� The Proventia A604 performed consistently and mostly reliably throughout our tests. Exposing the sensor interface to an extended run of ISIC-generated traffic had no adverse effect, and the device continued to detect all other exploits throughout and following the ISIC attack.� Please refer to the Testing Methodology section for full details of the methodology used and performance results.� We installed one sensor with the latest signature pack, reporting to a single SiteProtector server. We used a modified version of the default Attack Detector policy, which had all attack signatures enabled (apart from port probes) as well as some key audit-only signatures.� Signature recognition was excellent out of the box (99 per cent), and was increased to 100 per cent after the application of a signature pack update which was provided to us in just 24 hours. � We noted a minimum of “noise” in this release, with very few test cases raising multiple alerts for a single exploit. All our “false negative” (modified exploit) cases were detected correctly, demonstrating that the Proventia signatures are designed to detect the underlying vulnerability rather than a specific exploit.� Resistance to known evasion techniques was excellent, with Proventia being one of the few products to collect a clean sheet across the board in our evasion tests. Fragroute, Whisker, ADMmutate, running exploits on non-standard ports and even RPC record fragging all failed to trick Proventia into ignoring valid attacks.� Note that not only were the fragmented and obfuscated attacks detected successfully, but every one of them was decoded accurately as well. This is the level of performance to which we would like to see all IDS products aspire.� Out of the box, the Proventia A604 handled over 1 million open connections easily. The sensor also continued to track state on our “half open” exploits beyond its configured maximum open connections, since Proventia is designed to ignore new connections once the limit is exceeded, but does not age out old ones. � If you prefer old connections to be aged out in favour of allowing new ones when the state tables are full, ISS has added a parameter in the latest release which makes this behaviour configurable too.� Please refer to the Testing Methodology section for full details of the methodology used and performance results. This part of the test procedure consists of a subjective evaluation of the features and capabilities of the product, and covers installation, configuration, policy editing, alert handling, and reporting and analysis.� As you would expect from an appliance that is designed to be as close to “plug and play” as possible, installation is very straightforward. Initial configuration is performed at the appliance, the simple configuration menu being presented automatically when logging in to the admin account. The admin interface on the Proventia A604 is designed to disallow any OS modifications, and the Root account should never be used - ISS will not support any configurations that are not accomplished from the admin account.�
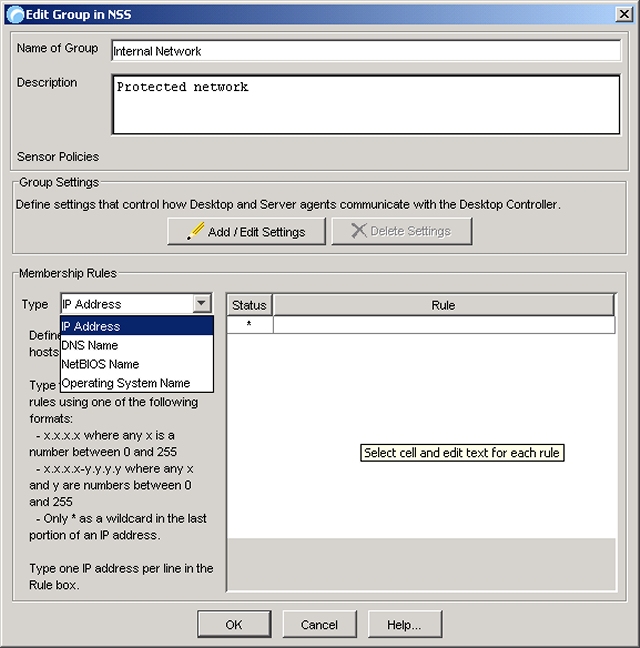
The simple, text-based menu enables the administrator to configure network settings, date and time, admin password, allow or disallow SiteProtector access, restart the protection Agent, configure the TCP Reset/Kill parameters, reboot and shutdown the appliance. A recovery CD provides the means to completely re-install the appliance software should that prove necessary (following disk corruption, for example).� Once configured, the Proventia appliance can only be accessed via a serial cable using a communications application such as Hyperterminal, keyboard and monitor, SSH, or SiteProtector.� Documentation is generally excellent for the Proventia range. It is provided as PDF files or hard copy, and includes an Installation Guide and User Guide for each of the components. The level of detail is good, and we found coverage of all the main features to be reasonably comprehensive and very clear. The SiteProtector Strategy Guide is an extremely useful additional manual which provides best practice guidelines and suggestions for securing a network, offering a guide to deployment and use in a range of organisation sizes and complexities. SiteProtector provides scalable, centralised security management and data analysis capabilities for all Proventia appliances, RealSecure Network, Server, and Desktop agents, and ISS' scanning applications. SiteProtector simplifies Proventia deployments through unified command, control and monitoring, the aim being to reduce security management demands on network traffic, staff or other operational resources.� The first goal of SiteProtector is to provide the administrator with a more logical view of the security boundaries under his control. Thus, rather than view individual sensors by machine name or IP address, they can be grouped together logically into departments or physical sites. �
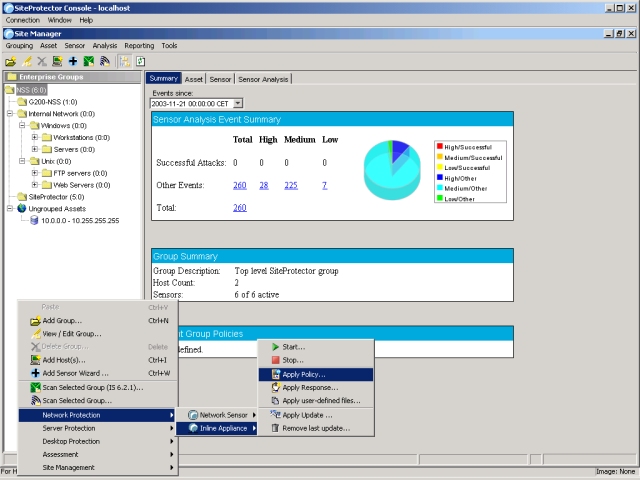
This makes it much more meaningful when viewing alerts or applying security policies. � Security assets can belong to more than one group for maintenance and reporting purposes, but can be “subscribed” to a single group for policy application, forcing policies to be deployed automatically each time they are amended. It is also possible to override this and apply policies on a per-sensor basis. This has been very well thought out, and provides one of the most flexible policy deployment capabilities we have seen.� Administrators can manage a wide range of sensors - both network and server-based - across the corporate network from a single Console if required. It is also possible, of course, to provide multiple Consoles to different administrators, and each one can be assigned different roles. For example, an administrator may control, configure and maintain the SiteProtector system and its components at the same time that localised security analysts perform command and control over the sensor infrastructure. However, these analysts remain restricted from configuring the SiteProtector system itself. Operators with viewing privileges cannot perform command and control functions, but may view the aggregated security information contained within a SiteProtector environment. � As with previous versions of the software, users are designated by assigning Windows users to specially created groups, which designate Administrator, Operator or Analyst. Within SiteProtector, these users can then be permitted or denied access to individual resources - groups or sensors - within the Site. Users can also be permitted global access to all Sites with a single login, or be forced to authenticate to each site individually as they drill down when performing analysis. As new sensors are installed they can be registered manually or automatically (via a scanning operation) with the SiteProtector Console. As new assets (hosts or sensors) are registered, it is possible to auto-group them according to pre-defined rules (such as domain name, IP address range, and so on). � Since default policies can be applied at group level, it is possible to install a sensor, have that sensor register itself, assign it to a group and apply a policy without any direct action being required from the administrator. This is a nice feature.�
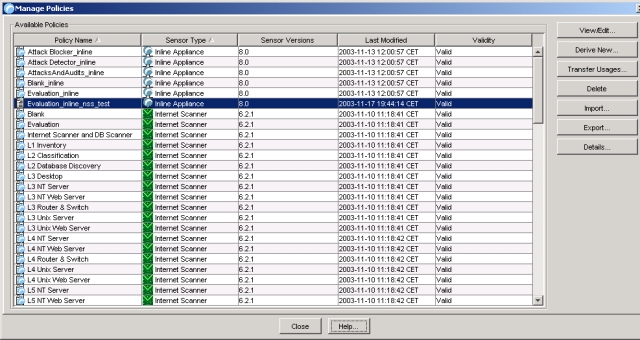
Command and control of a group of sensors can be achieved with a single click by selecting multiple sensors and right-clicking, or by applying management operations at group or site level, in which case all sensors beneath are affected simultaneously. � Context-sensitive menus appear following a right click to provide the option to start and stop sensors, apply policies, apply global responses, apply updates, remove updates, or run vulnerability scans (if Internet Scanner is installed). Whenever a command and control operation is selected, the option is provided to run once or to schedule multiple repeated operations. This would allow the administrator to have different security policies applied across a range of sensors on weekdays to those applied at weekends, for example. The potential time savings for large-scale deployments are enormous, and the ability to organise assets by multiple nested groups within multiple sites and apply management operations at any level of the hierarchy make the system extremely scalable.� Key database management tasks can also be performed via the Console. Automated backups can be configured in the user interface by right clicking on the database, as well as sophisticated automated purging by event categorisation type. This latter feature enables the administrator to set a time interval for keeping exceptions, incidents and un-categorised events, and to set granular filters on specific events to define exceptions to the automated purging regime.� The most important configuration task, of course, is to assign a security policy, and four default - and fixed - policies are provided with the system (additional policies are available for backward compatibility with previous versions of RealSecure). Different policies are defined with different modes of protection in mind. �
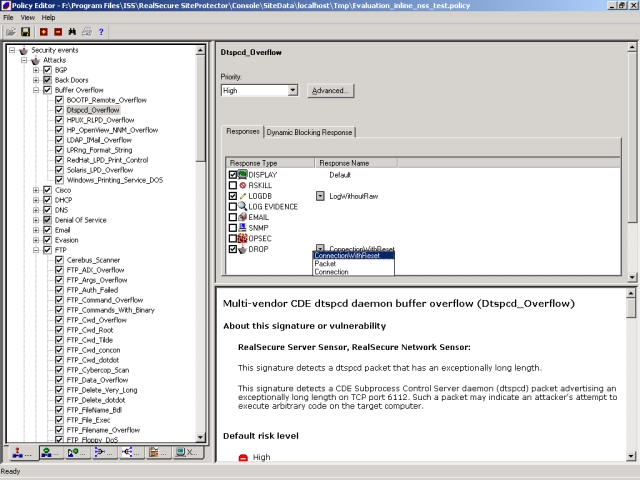
For example, one has all attacks and audits enabled, whilst another has attacks only. There is also an “Evaluation” policy which has all attacks enabled (apart from port probes) along with certain key audit signatures. There is no performance impact when all signatures are enabled. Even if a signature is turned off in a policy with Proventia, it is ignored for alerting purposes only, but is still included in the attack detection phase. Thus the Proventia effectively always runs with all signatures enabled. The Policy Editor�used in SiteProtector is the one remaining legacy of the old Workgroup Manager product, and is due to be replaced throughout the product range later this year by the new - and much slicker - Java-based Common Policy Editor.� It is certainly easy enough to create new policies - simply select one of the existing policies and click on “Derive New Policy”, give it a name, and you are free to create your own policy using that as a template. There are six tabs on the policy definition screen, including:�
The Security Events tab lists all the available attacks in the signature database, and these can be enabled or disabled by clicking on a check box next to each one. The available signatures are split into two categories - Attacks and Audits. Attacks are those events which are deemed serious enough to warrant an alert (DOS attacks, Trojans, Web exploits, etc) on any network.� Audits are events which may be considered suspicious but may be prone to false positives if enabled on certain networks. For example, one Audit signature monitors all SNMP activity, which is only of use if you do not run SNMP on your network. Other Audit signatures monitor “reconnaissance” events such as FTP SYST, SMTP EHLO, or Bind Version requests.�
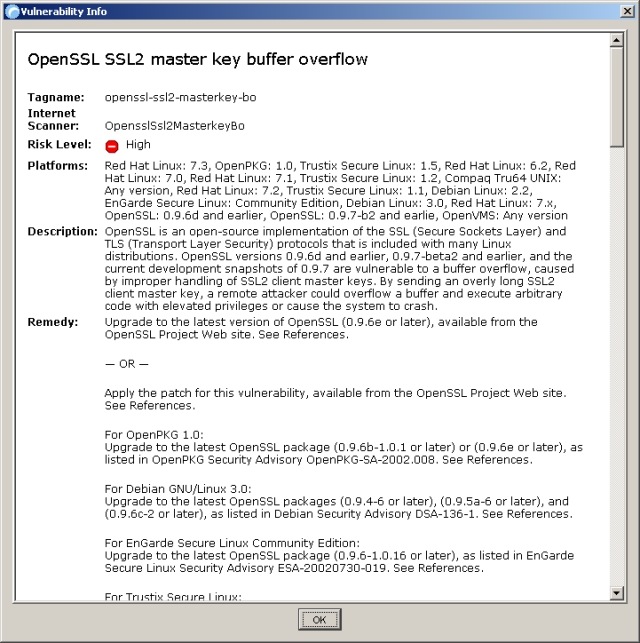
Most companies would begin with the Evaluation policy, which includes all the serious attack signatures and some key audit signatures (this is basically the one we used for our tests). This can then be tuned to remove any false alarms and add in any Audit events which may be useful on a particular network. The Attacks and Audits policy would provide the most complete coverage out of the box, but would provide far too many false alarms and superfluous data on most networks.� Selecting an individual attack brings up a detailed description of the attack (including its effect and how to counteract it) and a configuration screen. There is a wide range of attacks available, and new ones are added at regular intervals through the efforts of the Internet Security Systems X-Force team. The Web-based update procedure is very straightforward and easy to use, and allows the administrator to download new signature files (known as X-Press Updates (XPU)) to the network and update individual Proventia installations from those, all of which can be accomplished from the Console. � Unfortunately, new signatures are only included on the XPU tab, and not in the main Security Events tab, which makes them very difficult to find unless you know exactly where they are. This problem should be eliminated by the use of the Search function, but for some reason this never searches beyond the first occurrence of the search string entered. Policy definition can thus be more difficult than it should be. It would be nice to see the Search function extended to produce search results consisting of multiple signatures, and also allow searching on additional criteria.�
The attack priority sets the priority flag which can be used for filtering and reporting, and this can be escalated automatically by the Fusion module if it determines that an attack was successful. For each event there are also a number of responses available, including:�
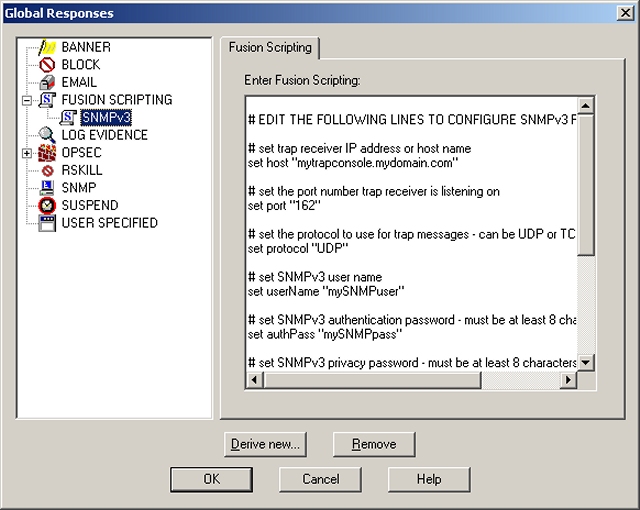
Kill connection resets the IP connection to terminate the attack immediately, whilst the OPSEC option allows Proventia to automatically reconfigure any OPSEC-compliant firewall to prevent further attacks. � Response settings become the defaults for individual signatures, but these can be overridden in bulk by applying different response settings at sensor, Group or Site level. � There is also an Advanced properties screen that once provided the means to edit any additional parameters that might apply to a specific attack signature, as well as to define how multiple events should be handled and propagated from sensor to Console. � This has changed following the integration of the BlackICE software, and both the Event propagation control - the means by which rapidly occurring attacks can be consolidated into a single alert to prevent network floods - and tuning parameters for individual signatures are now made available via a set of parameters that are applied at the sensor level. �
Event coalescing worked extremely well in our tests, with each alert generated containing a repeat count to show how many attacks of that type were actually detected. This count remains accurate until the sensor is under extreme loads, at which point a “pre-coalescer” cuts in to drop a percentage of identical packets before they are passed to the parsing engine. Proventia can be used to monitor more than just security problems by using the Connection Events. These are generic events such as HTTP, FTP or SMTP activities, and can be filtered by source or destinations address, source or destination port, or protocol. One possible example of how this could be used would be if company policy forbids the use of Telnet. Proventia could be configured to monitor for TCP port 23 and log the source and destination addresses of the perpetrators, perhaps blocking the process completely too.� User-defined signatures allow the administrator to apply regular expression string matching on certain fields within a packet (login name, URL data, e-mail subject, etc.) to determine suspicious content. This could be used as a “quick and dirty” virus checker by creating a signature that raises an alert every time it detects a packet with a specific string in the e-mail subject field, or to monitor and alert on attempts to login as Root. � User-defined signatures containing regular expressions can be a performance drain. However, it was not necessary to turn off RegExp parsing of custom signatures in order to achieve 1Gbps detection rates. Note that this is the limit of signature customisation via the Console interface - the built in signatures remain virtually untouchable. However, Proventia does include the Trons module which provides the means to add completely custom rules using the Snort rules definition syntax. � Although neither TCP reassembly nor any of the standard Snort plug-ins and pre-processors are supported, Trons does allow the administrator to add brand new signatures using a familiar “language” that is reasonably easy to learn and simple to use. And, of course, there is an entire library of signatures ready made on the Snort Web site, though Internet Security Systems does not recommend you add them all. �
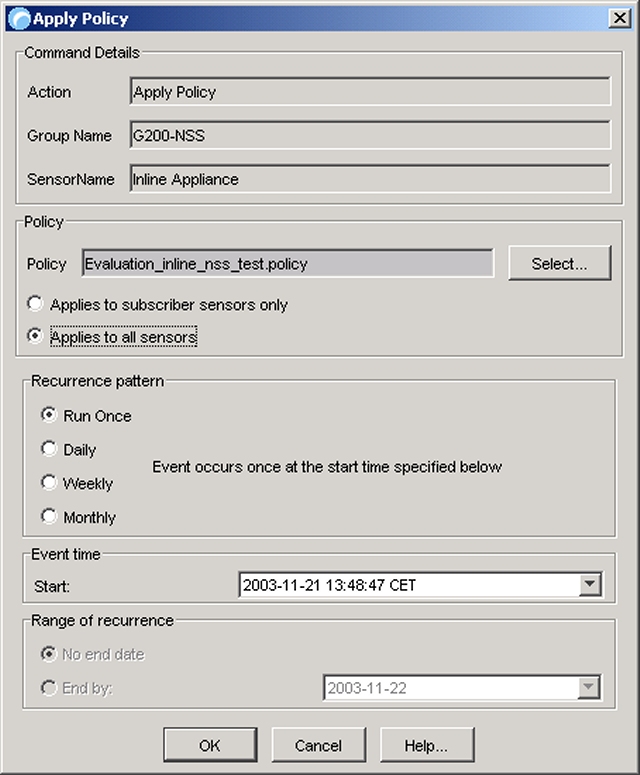
Apart from a significant overlap in functionality between the Snort and built-in signatures, there would be a heavy performance impact. Because the Trons module is currently completely separate from the Proventia PAM (this will not always be the case in future releases), the signature parsing path is not exactly optimised, and thus Trons signatures should be kept to a minimum. The Trons module is also disabled by default. We found it very straightforward to add Snort signatures to our Proventia sensor, and the resulting alerts are displayed in the SiteProtector Console alongside all the built-in alerts, but including Snort-specific data in the Event Inspector window, such as the Snort SID, external reference, version number, and so on.� Finally, if there are genuine events which are raising false alarms via Proventia, the Packet Filter tab allows the administrator to define which packets should be ignored for alerting purposes, based on protocol, port or IP address. All packets matching one of the defined packet filters are rejected before being processed by the parsing engine. � Where it is still required to disregard specific events that have been detected by the sensor - perhaps because they are known to be false positives when coming from a particular host - then the Event Filters can be used. Here, the administrator can specify an event name, together with source and destination IP address and port, and any event detected by the sensor matching these criteria is simply ignored.� Once policies have been defined they are applied to individual sensors, Groups or Sites via the SiteProtector Console. Multiple policies can be defined for different functions (i.e. DMZ or internal network) and applied to a range of sensors via the asset hierarchy. Policy application can be performed as a one-off process or scheduled for regular runs, thus allowing administrators to apply different policies at different times (days and nights, weekdays and weekends, and so on). �
If the administrator makes a change to an existing policy, SiteProtector will determine which sensors are using that policy and provide a list to the administrator allowing him to deploy the policy to all sensors in one go, or just a selection of them (by deselecting checkboxes).� The existing Policy Editor in SiteProtector 2.0 is actually one of the few remaining legacies from the old Workgroup Manager Console. This will be replaced in the near future by a new - and much more feature-rich and intuitive - Java-based Common Policy Editor that will provide granular policy control and a single interface for all types of security policies to be applied via SiteProtector (i.e. not just for Network IPS/IDS products, but also for vulnerability assessment, host-based protection, and so on). Once a sensor is up and running with a policy applied, alerts are logged locally on the sensor (if required) and then forwarded to the designated Event Collector, from where they are stored in the database. At user-defined intervals, the SiteProtector Console retrieves new events and displays them in the Analysis pane in a “spreadsheet” format.�
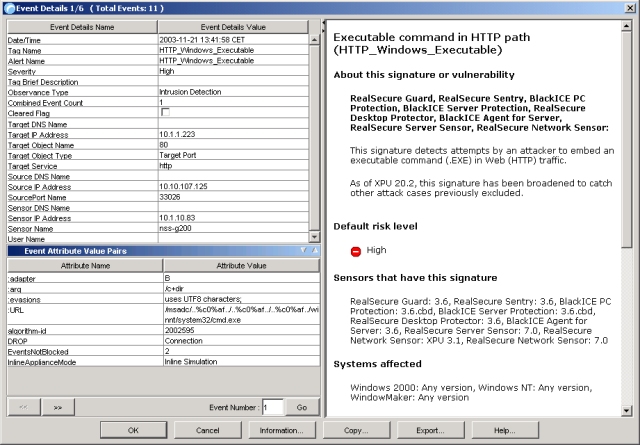
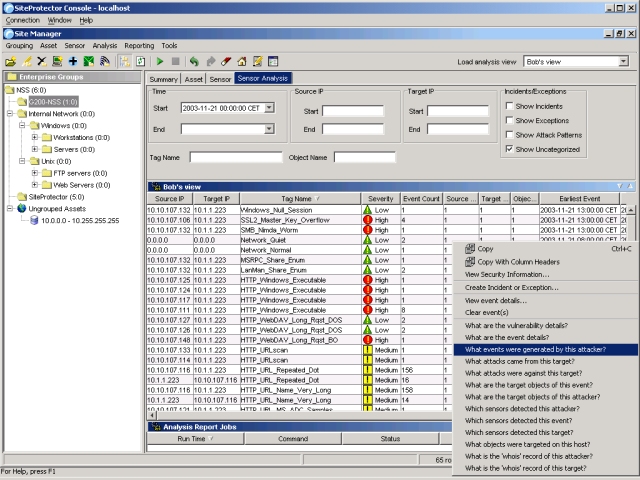
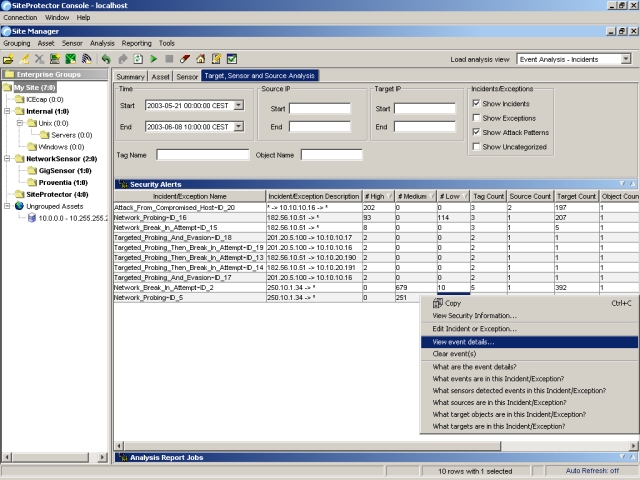
Each row of the spreadsheet displays the complete alert details, including date and time, source and destination IP address, source and destination port, severity, status, URL/command that cause the alert, and so on. Right clicking on an alert provides the ability to view all alert details in a single window, which makes it more readable. It is also possible to call up the detailed X-Force information on that alert.� Although the ability to view detailed packet contents is missing, a configurable parameter within the sensor enables full packet logging, the results of which can be viewed via a third party tool such as Ethereal. There is no link from any particular event to a specific packet, or group of packets, within the log file, however. Of greater value is the ability to provide extended context information as part of the event. This information is collected for every stateful session being tracked by the sensor, and is collated and made available to the Event Collector whenever a new alert is raised. This information includes data specific to the actual alert - such as the offending URL or buffer contents in the case of an HTTP overflow - as well as pertinent data collected from packets leading up to the exploit - such as user name and password used to log in to the server in the case of an FTP session. In most cases this is of much more use than detailed packet contents, since the data leading up to the packet which triggered the exploit is often of equal importance to the contents of the trigger packet itself.� A number of other options on the right-click menu guide the administrator through the process of “drilling down” through the data to get to the most important and relevant information. This is done by providing a number of plain English “questions” such as “What are the event details?”, “What events were generated by this attacker?” and “What attacks were against this target?”.� A number of filter options are provided along the top of the screen, allowing the administrator to home in on the data that is of interest by specifying source and target IP addresses (or ranges), ports, date and time stamps, and so on. � One extremely useful feature is the ability to create “baselines”. At any given point in time, the current analysis view can be “frozen”, which maintains the totals and counts (such as event count, target count, and so on) on screen. Any increases or decreases in those totals are then shown in red as plus or minus figures from the baseline, making it easy to spot trends during an investigation. � The baseline enables the administrator to determine, at a glance, how events have changed in an analysis view. If, for example, he notes that one IP address or tag name is associated with an unusually high increase in the number of events, he can investigate it to determine whether it represents a threat.
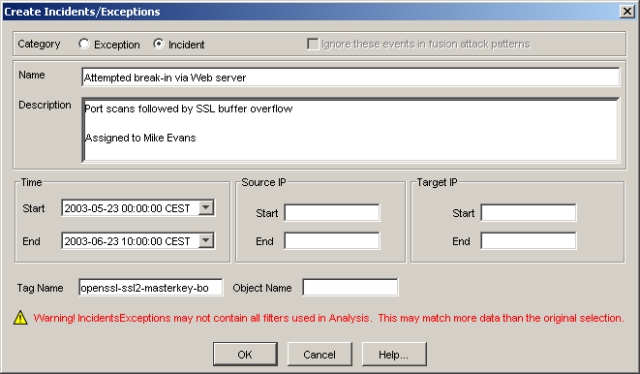
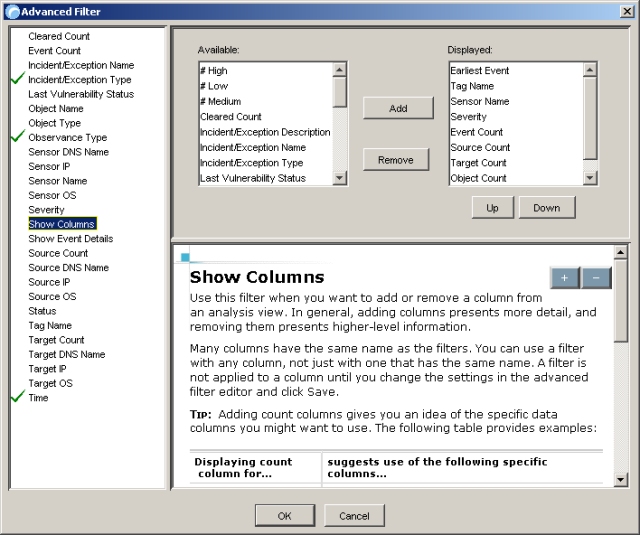
Different analysis views can be loaded directly from a drop-down menu, each one providing a different data layout (a different “report format” if you will), and these are almost infinitely customisable via the ability to define column layouts and filters to be applied to the underlying data. Once the administrator has fine-tuned the analysis to his satisfaction it can be saved for subsequent recall. Events that are deemed unimportant can be designated as “Exceptions” and they will subsequently not appear in analysis views. This does not prevent them from being detected in the first place, merely from being displayed for analysis - it would be nice if there were a right-click option to enable the signature that caused the alert to be disabled in the policy. � Should the administrator determine that a group of events are related (perhaps a port scan, followed by a buffer overflow, followed by attacks launched from the compromised machine) they can be groups together as an “Incident”. These events are then removed from the normal analysis display and are shown only in the Incident analysis views. This allows the administrator successively to reduce the data displayed, resulting in the ability to “find the needle in the haystack”. � Incidents are tracked as a unit from that point on, and the incident can be annotated with actions taken to resolve it. This is an extremely useful feature, and would be even more useful if it were possible to flag each incident with a status (pending, resolved, under investigation, etc) and an owner.� SiteProtector’s modular format enables plug-in enhancements for a wide range of security management needs, and the SecurityFusion module is the first plug-in module for SiteProtector. This extra-cost module uses data correlation and analysis to rapidly and automatically derive the likelihood of a successful attack from aggregated vulnerability assessment information. Visual cues in the SiteProtector Console indicate attacks with a high probability of success, with automatic escalation criteria for critical security events.�
For example, the module can escalate important events by generating additional responses outside the Console (such as email or SMTP). Alternatively, it can de-emphasise less important events by reducing alert priority or by selectively preventing an event from being displayed or logged. All escalation and de-escalation options are fully customisable. During testing, we noted that a specific alert - a DNS Zone Transfer - was escalated from the normal event priority of medium to high because Internet Scanner had previously determined that the particular host against which the transfer was made was potentially vulnerable to spurious zone transfer requests. On the other hand, it would be possible to “downgrade” an alert from high to medium or low if the attempted attack - say an FTP exploit - was against a host with no vulnerable FTP service running. �
This approach can help to reduce false alarms, and can certainly reduce the load on the administrator since it would be possible to record all suspicious events for trend reporting and forensic analysis, whilst only alerting on events where there is a real chance of an exploit targeting a vulnerable host. � The potential downside, of course, is the necessity to run Internet Scanner at sufficiently regular intervals to make the data correlation effective, but SiteProtector makes it easy to schedule Scanner runs in order to achieve this. In addition to the escalation and downgrading of alerts, Fusion also records its assessment of the alert (failure, likely to have succeeded, etc.) in the alert details, making it available in analysis views and reports.� The most valuable feature of Fusion, however, is its correlation capability - the ability to analyse and group alerts into Incidents. If Fusion detects a pattern of events similar to the one we mentioned earlier - a port scan to a particular host, followed by a potentially successful exploit, followed by further port scans and exploits launched from that host (indicating that it had probably been compromised) - then it would group all of these alerts together into a single Incident. � Because alerts within Incidents are removed from the normal analysis review, the result is a much smaller number if unclassified events to deal with. And by focussing on the Incident analysis first, of course, the administrator can be sure of spending his time dealing with genuine problems. Naturally, when operating inline it still remains within the administrators control whether to block the individual events or to alert only.� The alert-handling capabilities of SiteProtector 2.0 are a huge improvement over previous RealSecure management consoles, and this is one of the better IDS consoles we have seen in our labs. ISS has provided an almost infinitely customisable analysis tool in the shape of the Sensor Analysis tab that we discussed in the Alert Handling section. � A number of very useful basic views are provided out of the box, including Attacker, Details, Event name, Incidents, Sensor, and Target. However, the real power of the system lies in the fact that it is possible to create a limitless supply of customised views by specifying your own column layouts and filters. These custom views can be saved for later recall, and can also be saved as reports in PDF, HTML or CSV format. � When saving HTML files, an index is automatically created of all reports saved, making it easy to publish management reports to a Web site if required. All reports can also be scheduled to run at regular intervals, and query performance has been improved significantly in the latest release.�
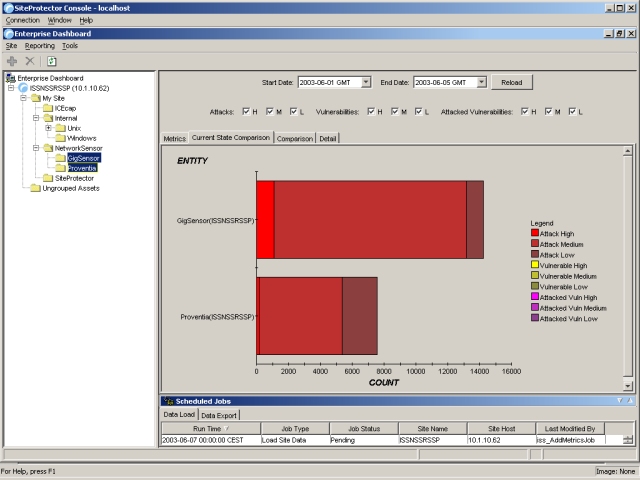
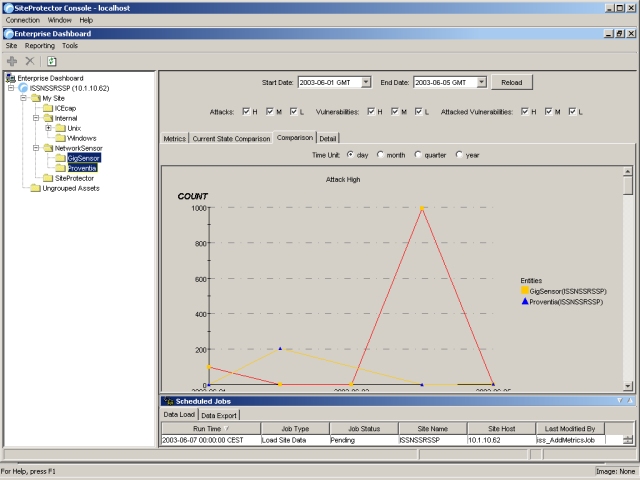
In addition to the analysis views, SiteProtector also provides the Enterprise Dashboard. This allows the administrator to:�
The Metrics and Trends pane enables you to view security results for specific assets, sensors, and sites, and to create reports that display trends. The information in the Metrics and Trends pane is based on the filters you select in the Filters pane. This displays information on the following tabs:�
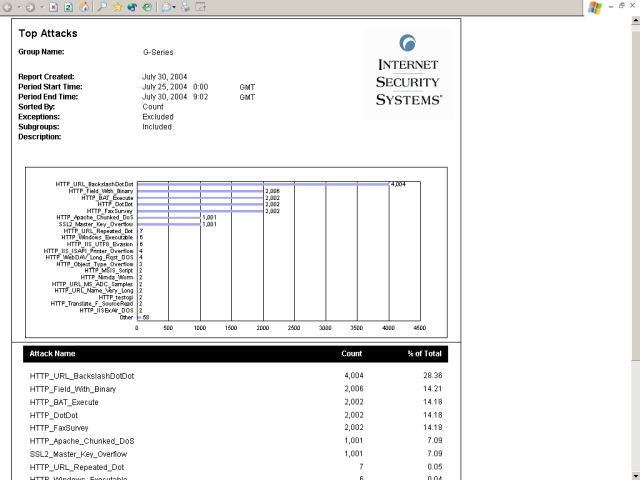
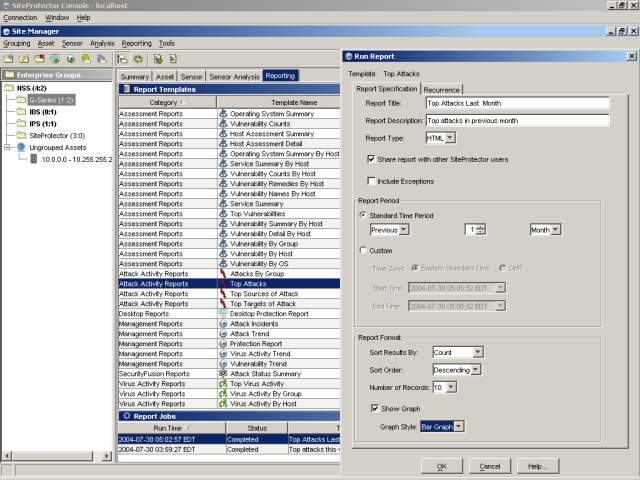
Even though the detailed packet contents are not stored as part of the Proventia database, it is possible to store detailed packet logs of all traffic seen by the sensor (packet logging) or just packets associated with specific signatures (evidence logging). �
When packet logging is enabled, Proventia records all system traffic into log files, the size of the files and rotation characteristics controlled via the Advanced Properties tab for each sensor. It is important to note that packet logging keeps track of all system traffic, not just intrusions, which can result in some large files and would obviously have quite an impact on performance. If it is required to be more selective in what is recorded, evidence files can be used. These are controlled via the global or per-signature settings in the policy files. Whenever a particular attack is detected that is flagged as “Log Evidence”, Proventia captures network traffic specific to the attack in progress and stores that information in an evidence file. � Both Packet and Evidence Logs are encoded as Sniffer or tcpdump trace files, and will require a decoding application (which is not included) to view the contents. Unfortunately, these log files must be retrieved manually from each sensor (although they can be retrieved centrally via the Console) and there is nothing to tie the individual alerts in the database to specific evidence files, making forensic analysis more difficult than it should be.� Finally, the latest release sees the introduction of text-based and graphical management reports, provided by an extra-cost option based on the ubiquitous Crystal Reports product. There is not much within this module that will interest the forensic analyst, since these are aimed more at producing higher-level summary reports, providing pre-defined templates for Top Attacks, Top Attack Targets, Top Attack Source, Attack Incidents, Attack Trends, and so on. There are also a number of templates that rely on information produced by other modules besides the Network IPS on test here, including numerous assessment (from Internet Scanner), desktop protection, and virus reports.�
They will certainly be of interest to those who require to monitor trends in the type and severity of exploits detected, or in their effectiveness at handling security incidents, and are thus aimed more at manager-level. This is one area that was omitted from the early Site Protector releases, and this module plugs a gap for those who require more than straight event analysis capabilities.� In selecting a report template, the user is presented with a screen which enables him to name the report, select a report period, and a report format. The report period settings provide an excellent range of pre-defined date ranges, as well as the ability to specify your own down to the nearest minute - we suspect that most users will opt for the “current week” or “previous month” settings at the� click of a mouse, and wish that all vendors would allow date ranges to be specified in this way.� The formatting options are fairly basic, usually limited to selecting a sort order, number of records to be displayed, and whether or not to show a graph. The output of the reports is thus fairly fixed, but it is tidy, well-presented and easy to read.� Performance Clearly a lot of effort has been put into designing the Proventia hardware to cope with the bandwidth claimed (600Mbps on the A604) and in producing custom drivers for the built in network cards. This care allowed Proventia to detect and log 100 per cent of attacks under all of our test conditions. We would have no hesitation in rating the Proventia A604 as a true 600Mbps IDS device, and are confident that it could actually perform well beyond this level on any normal network.� The Proventia A604 also performed consistently and reliably throughout our tests, continuing to detect attack traffic in a consistent manner even when under extended attack. Exposing the sensor interface to an extended run of ISIC-generated traffic had no adverse effect, and the device continued to detect and log all other exploits throughout and following the ISIC attack.� Security Effectiveness Signature recognition was excellent out of the box (99 per cent), and was increased to 100 per cent after the application of a signature pack update which was provided to us in just 24 hours. � All our “false negative” (modified exploit) cases were detected correctly, and none of the false positive test cases triggered. Resistance to known evasion techniques was also excellent, with Proventia being one of the few products to collect a clean sheet across the board in our evasion tests. Not only were the fragmented and obfuscated attacks blocked successfully, but every one of them was decoded accurately as well. This is the level of performance to which we would like to see all IDS and IPS products aspire.� Usability With the removal of the aged Workgroup Manager Console and its replacement with the more scalable and flexible SiteProtector, Proventia has taken a huge leap forward. � The only significant portion of “legacy” code remaining in the user interface is the Policy Editor, though this is due to be replaced in the not too distant future with the new Java-based Common Policy Editor. This, as its name implies, will provide a common policy management interface across the entire Proventia range. The old Workgroup Manager Console was one of the most comprehensive and easy to use out of the box and for a long time was the benchmark against which other IDS consoles were measured. With SiteProtector, ISS has done it again, producing one of the best consoles we have seen in our labs to date. It is worth pointing out that this is no longer an extra cost option, but is included in the price of the sensor (the SecurityFusion and new Management Reporting modules remains extra-cost options, however).� Sensor and policy management are amongst the most straightforward and scalable that we have seen to date. Policies can be applied to multiple sensors at the click of a mouse, and the use of rules to auto-group assets together with the ability to apply policies at site or group levels (manually or via automated “subscription”) means it is very easy to install and activate sensors with little or no administrator intervention. Currently, Proventia is probably one of the easiest products to deploy across a large, distributed network that we have seen.� Alert handling, too, is excellent, with SiteProtector attempting to simplify the life of the administrator via automatic impact analysis and event correlation across vulnerability assessment tools and network sensors. � The result should be the ability to reduce the number of critical alerts appearing at the Console to a more manageable level in even the largest installations by grouping them together and tracking them as “incidents”. The ability to report and annotate at an incident level is useful, as is the ability to manually correlate multiple events into a single incident if required. � Infinitely customisable views provide the means to drill down into the event data from almost any angle via the Sensor Analysis tab in the Console. The resulting views can be saved and recalled on demand or run at regular intervals via a scheduler, and the Dashboard provides high level graphical summaries. It is nice to see a company producing a genuine advance in reporting and analysis tools rather than relying purely on Crystal Reports and a few basic pre-defined templates. � Having said that, the latter is now used to flesh out the reporting capabilities by providing a number of pre-defined management reports as an extra-cost option, thus covering all possible reporting angles. Company
name: Internet
Security Systems, Inc. Click here to return to the IDS Index Section |
Send mail to webmaster
with questions or�
|