|
|
|
Sourcefire’s 3D product suite has been designed as an integrated real-time network defence infrastructure for identifying and protecting against network threats.� In addition to the usual Network-IDS sensors (various models to handle a wide range of bandwidth requirements up to 1Gbps currently) and a centralised Defense Center management appliance, the 3D product range also includes the unique RNA Sensor. This is a passive scanning device which monitors network flows, identifies new hosts, operating systems and services on the network, provides policy enforcement capabilities and offers additional context for the IDS alerts based on its extensive knowledge of the network. � The IS3000 appliance tested features the tried and tested Snort detection engine running on an Intel-based appliance with a high-performance network driver to provide the ability to monitor up to 1Gbps of traffic. In NSS tests, the IS3000 proved itself capable of handling 1Gps of traffic under normal network conditions. We also found the device to be to be very stable and reliable, coping with our extensive test suite with ease and without succumbing to common evasion techniques. � The Defense Center management system has been well designed to handle management and configuration of large numbers of IDS and RNA sensors across the enterprise. Alert handling, monitoring and reporting are all powerful and flexible, especially when combined with the additional contextual data provided by RNA, which could go a long way to removing one of the biggest perceived “problems” of IDS systems - analyst overload from irrelevant alerts.� The Sourcefire 3D System (also known simply as Sourcefire 3D) is composed of:�
Sourcefire also offers an Intrusion Agent for Snort, the open source Intrusion Detection System. Both Intrusion Sensors and RNA Sensors can be managed directly via a Web-based interface if Defense Center is not required. This report, however, focuses on management via Defense Center.� Sourcefire produces Intrusion Sensors for every network bandwidth need:
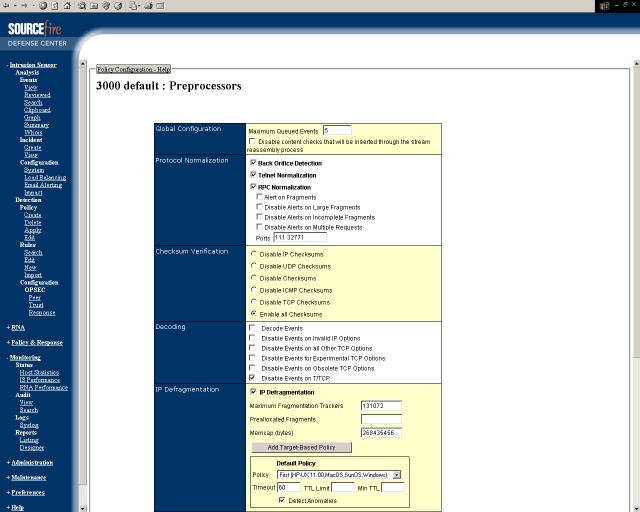
The model submitted for testing was the 1Gbps IS3000. This is a 2U appliance based on standard Intel hardware with dual Xeon processors, dual power supplies (not hot swappable), a large hard drive (for local storage of alert/log data and configuration parameters), 4GB RAM and a two-port Gigabit network card as standard. This can be used to operate in-line as an IPS device (one port in, one port out), monitor two separate subnets/SPAN ports, or recombine the separate connections from a network tap. It can also be augmented with an additional four port card if required.� The IS3000 runs a hardened Linux distribution with custom-written high-performance network drivers. Each Intrusion Sensor has several methods that it uses to look for the broad range of exploits. These methods include packet decoders and preprocessors that report on anomalous traffic that might signal an intrusion attempt. Next, the detection engine uses Snort-based rules to examine the decoded packets for pattern-based attacks.� Capturing and Decoding Packets Before packets can be inspected by the Intrusion Sensor, the packets must be captured from the network. Sourcefire has eschewed the standard libpcap in favour of custom-written network drivers in order to achieve Gigabit performance levels. � In most installations, one of the network interface cards (NIC) on the Intrusion Sensor is designated as the sensing interface. The NIC for the sensing interface is set to promiscuous mode, which means that it receives every packet on the network segment, regardless of whether it is destined for the Intrusion Sensor. Also, by default, the NIC on the Intrusion Sensor runs in stealth mode, which allows the interface to see network traffic without being visible or accessible to other hosts on the network. � As the Intrusion Sensor captures packets, it sends them to the packet decoder. The packet decoder takes the packet stream and converts the packet headers and payloads into a format that can be easily used by the preprocessors and the detection engine. Each layer of the TCP/IP stack is decoded in turn, beginning with the data link layer and continuing through the network and transport layers. � Processing Packets After the packets are decoded through the first three TCP/IP layers, they are sent to preprocessors, which normalise traffic at the application layer and detect protocol anomalies. After the packets have passed through the preprocessors, they are sent to the detection engine. � The detection engine inspects the packet headers and payloads to determine whether they trigger any of the rules. Preprocessors can be enabled or disabled as required to suit a particular environment. For example, one of the preprocessors normalises HTTP traffic. If the administrator is confident that his network does not include any web servers using Microsoft Internet Information Services (IIS), he can disable the preprocessor option that looks for IIS-specific traffic and thereby reduce system processing overhead (thus increasing performance of the system as a whole). � The detection engine takes three tracks as it inspects packets from the preprocessors: �
When a policy is applied to the Intrusion Sensor, and before it processes any packets, the rule optimiser reads in all the activated rules and classifies them in subsets based on criteria such as transport layer, application protocol, direction to or from the protected network, and so on. � As packets arrive at the detection engine, the engine selects the appropriate rule subsets to apply to each packet. After the rule subsets are selected, the multi-rule search engine performs three different types of searches:�
After the multi-rule search engine examines the packets, it generates an event for every rule triggered and adds it to an event queue. The event selector prioritises the events in the queue and logs an event to the event database. These are the events that appear in the sensor statistics and event reports. � Generating Events Packets are evaluated by the packet decoder, the preprocessors, and the detection engine. At each step of the process, a packet could cause Sourcefire 3D to generate an event, which is an indication that the packet or its contents may be a risk to the security of the network or, in the case of an attack that originates from within the network, to the security of an external network. For example, if the packet decoder receives an IP packet that is less than 20 bytes (which is the size of an IP datagram without any options or payload), the decoder interprets this as anomalous traffic and generates an event. � Similarly, at the preprocessing step, if the IP defragmentation preprocessor encounters a series of overlapping IP fragments, the preprocessor interprets this as a possible attack and generates an event. The same kind of response occurs within the detection engine, with most rules written so that they also generate events when triggered by packet or stream content. Each event in the database includes two types of information about the potential attack. The first is called an event header, and contains information about the event name and classification, the source and destination IP addresses and ports, the process that generated the event, and the date and time of the event. The second is the packet log, and includes a copy of the decoded packet header and packet payload. � The Intrusion Sensor has features for viewing all events, filtering them according to any number of criteria, creating incidents to gather information about events that seem related and warrant further investigation, and producing reports on event statistics.� Preprocessors The detection engine maintains a configuration file that details how, and in what order, the system executes preprocessors, as well as other configuration information. The order in which preprocessors are configured in this file specifies the order in which they act on packets. Sourcefire appliances simplify this by providing a way to configure preprocessors through the user interface. The default policy configuration sets the preprocessors to perform IP transfer layer protocol decoding first, then perform data normalization as needed.� This approach provides the following benefits: � The Intrusion Sensor can generate an intrusion event against fragmented IP datagrams that cannot be defragmented, and then stop inspecting those packets. The Intrusion Sensor can generate an event against TCP packets whose state cannot be validated, and then stop inspecting those packets. Only packets that can be appropriately tested by rules are normalised, optimizing performance by dropping TCP packets that cannot be reassembled and are not part of a valid TCP session.� The Defense Center is the centrepiece of the Sourcefire 3D System. Contrasted with RNA Sensors and Intrusion Sensors, which generate events based on the traffic they see, the Defense Center is a central management point that can manage both types of sensors and automatically aggregate the events generated by them. The Defense Center then correlates the different events in a way that helps the administrator understand the vulnerabilities on his network and the attacks against the hosts on it. � Event correlation occurs when the Defense Center manages one or more Intrusion Sensors and one or more RNA Sensors on the same network segment. In this configuration, the Defense Center qualifies each intrusion event from an Intrusion Sensor based on whether the RNA Sensor on the same segment detected a vulnerable service or open port on the host which is the target of the attack. � If the targeted host is not vulnerable, the impact of the attack is low (and the Impact Flag of the event is modified accordingly). However, if the targeted host is vulnerable, then the impact is high. The event views on the Defense Center also tightly integrate events generated by Intrusion Sensors and events from RNA Sensors. For example, the table view of intrusion events, which lists important information about each event generated by Intrusion Sensors, includes a hyperlink next to each internal host. Selecting this link displays a host profile generated by the RNA Sensor for that host. � The host profile lists the information about the host including the IP address, the MAC address, the operating system and vendor, the protocols and services in use, and the known vulnerabilities associated with the services and operating system. Similarly, as a network discovery event is viewed on the Defense Center, a link is provided to view all the intrusion events associated with that data flow.� If it is necessary to monitor a high bandwidth network segment, the Defense Center’s built-in load balancing can be used to divide the network traffic over two or more Intrusion Sensors. Although the Sourcefire product line includes Intrusion Sensors rated up to 8Gbps, it is possible to monitor even higher bandwidth networks without the need to deploy third-party load-balancing solutions.� The built-in high availability feature also allows the designation of redundant Defense Centers to manage groups of Intrusion Sensors and RNA Sensors (each Intrusion or RNA Sensor can be configured to transmit alerts to two Defense Center appliances). Event data streams from managed sensors to both Defense Centers, and certain configuration elements are also maintained on both Defense Centers. If the primary Defense Center fails, it is still possible to monitor the network for RNA events, intrusions, and policy violations without interruption using the secondary Defense Center.� RNA Sensors are appliance-based sensors that analyze traffic passively on the network segment where they are installed, and then build a network map showing the topology of that network segment. The network map can be used quickly to view information about: �
RNA Sensors also gather information about new hosts and services that appear on the network as well as changes to the existing network infrastructure. This makes Sourcefire 3D (with RNA) perfect for policy enforcement and change management, as well as intrusion detection.� RNA Sensors are delivered with a vulnerability database. This database, updated regularly, correlates known vulnerabilities with the operating systems and services running on the network and helps prioritise the steps needed to strengthen the network’s security. Once patches are applied that remediate the vulnerabilities, the administrator can mark specific hosts as no longer vulnerable. � RNA Sensors are also able to collect flow data, which allows them to track sessions for hosts on a monitored network. This flow data can be used to detect anomalous traffic within the network and between a network and the outside world. A feature called policy and response on RNA Sensors can be used to monitor compliance with corporate security policies. For example, if the security policy forbids the use of wireless access points, a compliance policy can be created that automatically alerts the administrator if a new router appears on the network. � Key components of RNA are also available as a software-only installation for Intrusion Sensors and Red Hat Linux servers. � The aim of this section is to verify that the sensor is capable of detecting and logging exploits when subjected to increasing loads of background traffic up to the maximum bandwidth supported as claimed by the vendor. � For each type of background traffic, we also determine the maximum load the sensor can sustain before it begins to drop packets/miss alerts. � The Sourcefire IS3000 was tested up to 1Gbps, the rated speed of the appliance. Performance under all but the most extreme load conditions was impeccable, with 100 per cent of all attacks being detected under all load conditions except the 10,000cps and 20,000cps HTTP tests (see Test Results section of this report). � In particular, the device turned in a flawless performance in all of our “real world” tests, and we would thus have no problem in rating the Sourcefire IS3000 as a true 1Gbps device under all normal network conditions.� The Sourcefire IS3000 performed consistently and mostly reliably throughout our tests. Exposing the sensor interface to an extended run of ISIC-generated traffic had no adverse effect, and the device continued to detect and log all other exploits throughout and following the ISIC attack. There were no residual stability problems.� Please refer to the Testing Methodology section for full details of the methodology used and performance results. We installed one IS3000 sensor with the latest signature pack reporting to a single Defense Center server. We used a modified version of the default policy, which had all attack signatures enabled apart from a small number of server-to-client signatures which are disabled by default for performance reasons. We also enabled some key audit-only signatures. � Signature recognition was acceptable out of the box (79 per cent), and was increased to 91 per cent after the application of a signature pack update which was provided to us in under 48 hours. � We noted a few test cases raised multiple alerts for a single exploit. Our “false negative” (modified exploit) cases also posed some problems, even following the signature update, indicating that many of the Snort signatures are still detecting the exploit rather than the underlying vulnerability. However, it should be noted that recent improvements in the Snort rule “language” and efforts by Sourcefire’s signature-writing team have done a lot to improve this area. A major concern in deploying an IDS is the raising of false alarms. We noted two false positive alerts from our test suite, both of which were fixed following the signature update. We also noted some “noise” from our standard network traffic traces (which contain nothing but basic NetBIOS and DNS traffic). As with most devices of this type, we would recommend deploying in a live network to determine how it responds to live traffic before purchasing. � Resistance to known evasion techniques was excellent following a code update to rectify some issues with FTP traffic normalisation. Once these had been fixed, Sourcefire collected a clean sheet across the board in our evasion tests. Fragroute, Whisker, ADMmutate, running exploits on non-standard ports and even RPC record fragging all failed to trick Sourcefire into ignoring valid attacks.� Note that not only were the fragmented and obfuscated attacks detected successfully, but all but one of them was decoded accurately as well. This is the level of performance to which we would like to see all IDS and IPS products aspire.� Out of the box, the Sourcefire IS3000 handled 1 million open connections easily, and the device appeared to be immune to stateless attack replay tools such as Stick and Snot. � Please refer to the Testing Methodology section for full details of the methodology used and performance results.� This part of the test procedure consists of a subjective evaluation of the features and capabilities of the product, and covers installation, configuration, policy editing, alert handling, and reporting and analysis.� Installation of the Entire Sourcefire 3D system is very straightforward since each device is provided as a complete turnkey appliance, and each appliance can be managed directly via a Web-based interface. In a full Sourcefire 3D installation, however, once the Sensors have been installed they are managed from the Defense Center rather than directly.� Initial installation is restricted to entering the IP address of the management interface of each device, should the default IP addresses be unsuitable. This is achieved either by changing a host on the management network to match the same default IP address range as the Sourcefire devices and then using the Web interface, or by logging in to the console of each appliance and changing the IP address via the CLI.� Unfortunately, if the latter method is preferred then it is necessary to log in as root and enter the appropriate Linux commands to change the IP address and select the default route. Whilst this is not a difficult task, and is well documented in the Installation Guide, we believe that it should not be necessary (or even possible) to login as root on the sensor, let alone have the administrator be expected to issue Unix commands. � Whilst root access may occasionally be required for serious troubleshooting or recovery, this should be tightly controlled. Instead, it would be better to have a separate admin or service account with a simple text-based menu covering all the most common admin functions such as setting network parameters, date and time, restarting the Snort daemon, shutting down the sensor, rebooting the sensor, and so on.� Once the IP details have been configured it is necessary to enable communications to the Defense Center (which includes an authentication process). Once the devices are communicating, it is necessary to apply license files and configure the Sensor devices to be managed within the Defense Center.�
Once this has been done, it is possible to manage the sensor configurations and view aggregated sensor data from the Defense Center’s user interface. The Defense Center allows the administrator to group sensors in order to more easily apply policies and install updates on multiple sensors in a single operation.� The documentation set is provided in electronic format (PDF files) only, and each appliance (Intrusion Sensor, RNA Sensor and Defense Center) has its own Installation Guide and User Guide. � The documentation is outstanding, amongst the best we have ever seen for any product in our labs. Apart from providing extensive instruction on all aspects of deploying and managing Sourcefire products, it also contains extensive background information on the technology and the concepts behind it. � This includes stateful inspection, stream reassembly, understanding stream-based attacks, understanding state-related exploits, packet reassembly, understanding fragmentation attacks, and so on. There is also an extensive and extremely thorough section on understanding and writing Snort-based rules. In other words, not only does the documentation cover everything you need to know about the product, but it also acts as a useful source of IDS/IPS-related reference material. � In addition, all of the extensive documentation is also made available as an on-line, context-sensitive help system. Wherever you are in the Sourcefire 3D management system, a click on the nearest Help icon will bring you straight to the relevant part of the documentation.� The Web-based UI is clean and fast, the latter being helped particularly by the fact that it is pure Web-based technology with not a line of Java code in sight. This also means that it is possible to access the management GUI from any permitted host on the management network (access can be restricted to certain hosts) without the need to install any local code or client software.
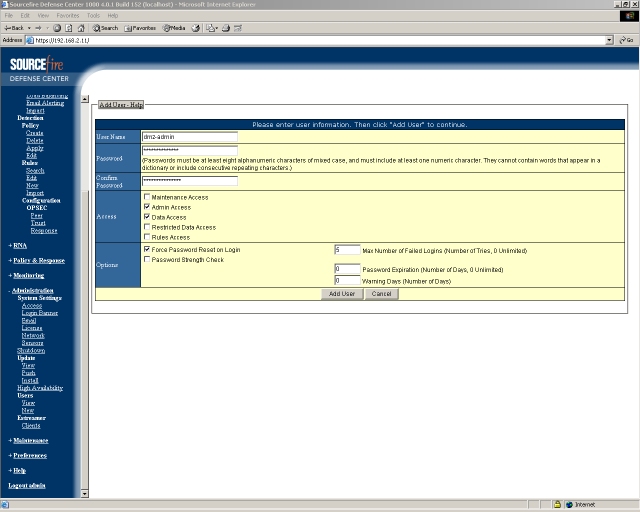
After logging in, the features that are accessible are controlled by the privileges granted to the user account. The administrator is presented with a dual-pane display: the left-hand pane contains a hierarchical menu containing options for Intrusion Sensor, RNA, Policy & Response, Monitoring, Administration, Maintenance, Preferences and Help. The right hand pane contains various data-entry windows which obviously depend on which menu option is selected. When the system was installed, the user who performed the installation created a single administrative user account and password. That account can then be used to create additional user accounts which should be used on a day to day basis. Certain user preferences can be specified for each account, including passwords, time zone settings, and event viewing preferences such as number of rows to display per page, default workflows to use in various parts of the UI, default auto-refresh interval (or disable auto-refresh), and so on. The following user privileges are available: �
From the remaining configuration menus, it is possible to define which IP addresses can access the Sensors, specify how many events the intrusion event database can store (when the maximum number of events is reached, the oldest events in the archive are deleted to maintain the event limit), and backup and restore system configuration files.� Backup files can be saved to the Sensor or to the local host, and it is possible to upload backup files to fully recover a Sensor to its saved configuration. Event and packet data can be saved at the same time as configuration data if required.� Rule updates can be downloaded manually (outside the GUI) and applied via the GUI, or can be downloaded and applied entirely via the GUI. New rules can be added to the Rules database in their default state or always disabled.� All of the critical management tasks can be scheduled to run at regular intervals, or as one-off jobs. It is possible to run backups, apply policies, generate reports, download rules and updates, and install rules and updates. Creating scheduled jobs is extremely easy using the calendar-format interface.� After adding scheduled tasks, they can be viewed and monitored via the same intuitive calendar interface, which provides a list of all scheduled tasks and a timeline. Intrusion policies provide a variety of components including: �
Sourcefire 3D provides a default intrusion policy for each model of the sensor, and we found the default policy to be very usable, with almost everything enabled barring:
Whereas the default policy may be adequate for many, it is obviously possible for the administrator to create custom policies with a tuned rule set and preprocessor configuration. This provides the means to improve both the IDS performance and the administrator’s ability to respond effectively to the events generated by an Intrusion Sensor.� There is a very useful Policy Wizard which leads the administrator through each step, allowing him to: �
In addition to defining variables, setting rule states, and configuring preprocessors, it is possible to specify intrusion event notification limits, define external intrusion event notification, and configure external responses to intrusion events within each intrusion detection policy (such as reconfiguring a firewall). � Some analysts prefer not to be inundated by multiple instances of the same intrusion event, but want to control how often they are notified of a given intrusion event occurrence. In some cases, for example, the analyst may not care about an event until it has occurred a certain number of times. Thresholds can be set to limit the number of alerts raised from a single attack, and it is also possible to suppress certain alerts based on the source or target (for example, suppressing port scan alerts when coming from a particular host which is used to perform internal port scans on a regular basis).�
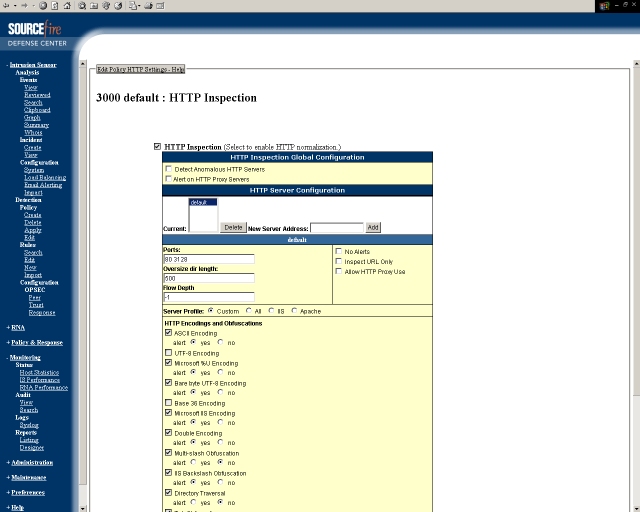
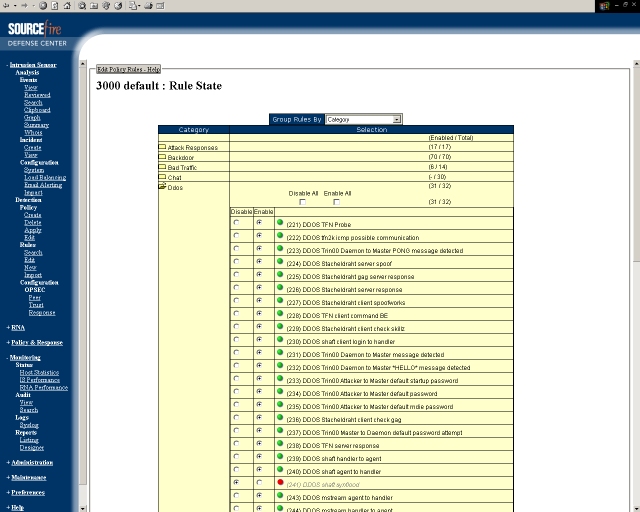
The system can be configured to send notification of intrusion events to systems that are external to the Sourcefire 3D, such as syslog servers, SNMP trap servers, and specified e-mail addresses. These can be set per policy only in the Policy Editor, but can be overridden on a per-signature basis in the Policy & Response module.� Sourcefire 3D categorises rules into groups based on functional area. The default settings include Category, Platform, Priority, Local, SANS Top 20, and Suggested Inline Rules, and it is not possible to create custom groups. On the Rule State page (accessed from the New Policy Wizard or Policy Editor), it is possible to deactivate or activate rules individually, or by rule category. For example, if there are no IIS web servers on the network, the administrator might choose to deactivate the entire web-iis category instead of deactivating individual rules within the category.� A disable/enable all check box makes this a simple operation. Note, however, that there is no search facility within the Policy Editor, and thus it is not possible to search for all rules which have Apache in the description and bulk enable/disable them in a single operation. There is a comprehensive search facility outside of the Policy Editor which allows searching on various parameters such as Message, Protocol, Signature IDS, Source/Destination Port, Keywords, and so on. However, this simply returns a list of matching signatures which can then be edited/duplicated one by one, and is not really intended to aid policy management.�
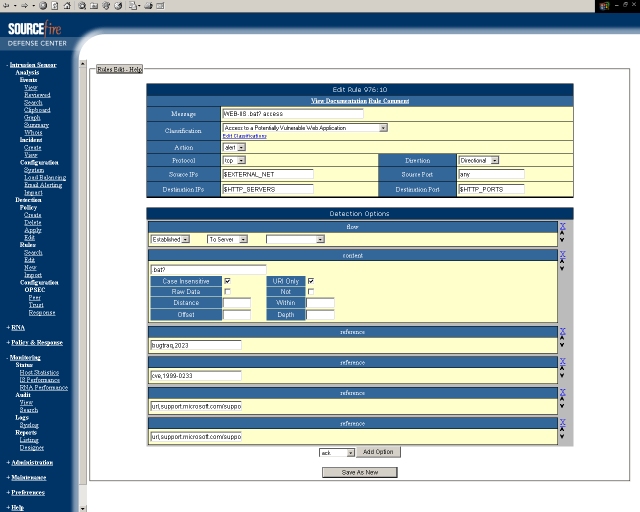
Existing rules can be modified, but the results are always saved as new Local rules (with a new SID) and the original rule is disabled. The original rule will never be reactivated by a Sourcefire update, preventing potentially nasty “clashes” where two different rules perform similar operations.� Sourcefire has attempted to wrap as much of the rule editing procedure in a usable GUI as possible, and for simple rules it has succeeded. All of the rule header information - such as Signature ID, Message, Classification, Action, Flow Direction, Source/Destination Port and IP Address, Protocol, etc. can be entered via simple text boxes and drop-down menus. However, the Snort rule “language” has become very feature rich, extensive and free format in recent years, and so each of the required detection options (content, byte jump, byte test, pcre, and so on) must be entered “long-hand” in one or more Detection Option boxes. Any number of these can be added from a drop-down menu at the bottom of the screen, and the Rule Editor uses these to build a standard Snort-format rule when the Policy is finally saved. Extensive documentation is available to assist with the rule-writing process.�
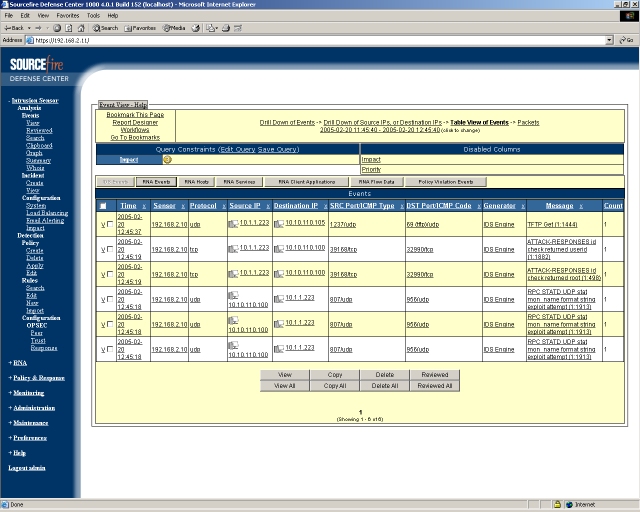
Once the policy is saved to the database, it can be applied to one or more Intrusion Sensors. This is a simple operation, where the administrator selects a policy from the list at the top of the screen, and then selects one or more Intrusion Sensors (or groups of Sensors) at the bottom. Once the Apply button is clicked, the job is added to the Task Queue to be performed in the background. The progress of the job can be monitored via the Task Queue screen.� There is no means to automatically re-apply a policy following modification. However, where a changed policy is currently in use, it will show that it has been changed on the Apply Policy screen against the sensor. The most efficient way is to group sensors logically according to the type of policy they will require - i.e. DMZ sensors have a DMZ policy - and then a single policy can be applied to an entire group of sensors in a single operation.� When a policy is applied, the contents of the policy database are written to each Intrusion Sensor in the usual snort.conf and associated rules files, before the Snort engine is restarted automatically to activate the policy.� Intrusion events are records of the network traffic that violates the intrusion detection policy on the Intrusion Sensor monitoring a specific network segment. These events can be generated by: �
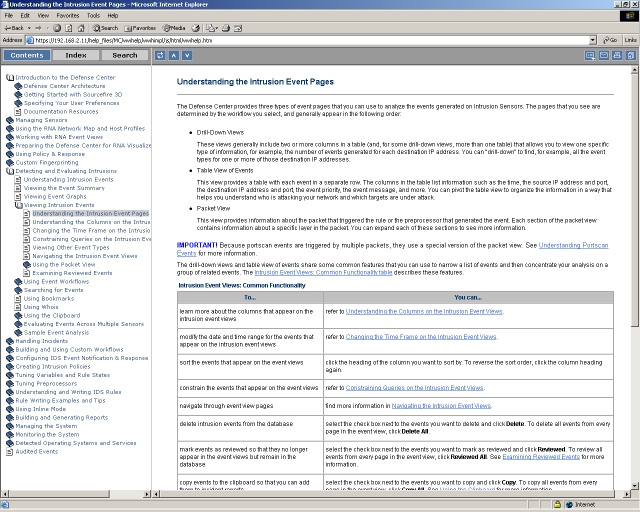
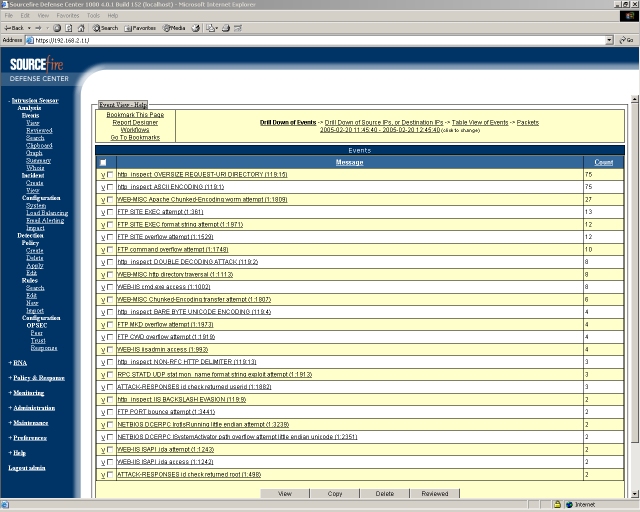
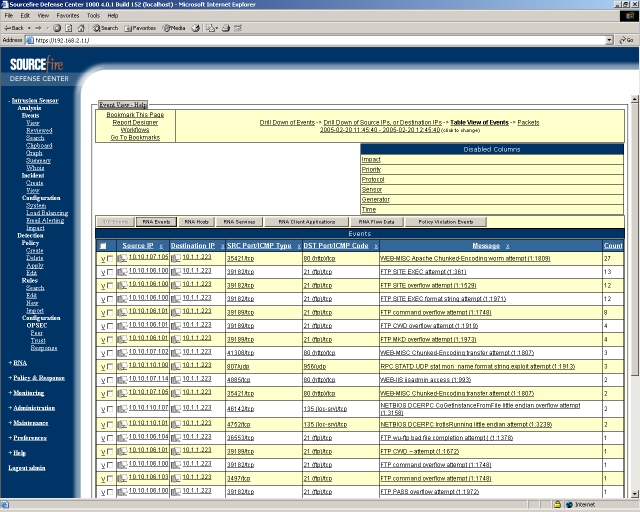
One of the unique features of the Sourcefire Event Viewer is the use of Workflows. These provide a pre-defined means of navigating and drilling-down through the event data, starting with high-level groupings, for example (perhaps by event name), and then allowing drill-down via source/destination port, individual event details, and down to packet contents
The Event Viewer presents a list of default Workflows:�
Each of these Workflows steps the analyst through a series of pages to help him narrow down a list of intrusion events to be evaluated. Custom Workflows can be created, allowing the analyst almost unlimited variations on how to process event data, and it is very easy to switch between different pre-defined and custom workflows as required. Once the analyst determines which Workflow is best suited to his day-to-day analysis needs, he can select a default Workflow.�
There is also a huge amount of on-the-fly customisation which can be performed on each default view, providing incredible flexibility in how event data is processed. Each individual event includes the following data:�
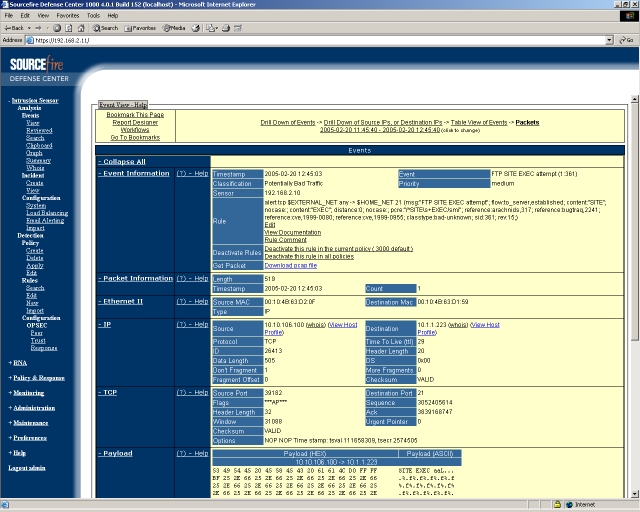
It is also possible to view the packet that was captured with the event, and each of the rows associated with the packet can be expanded to display additional information. This includes both detailed packet contents and the associated event information, which comprises the rule which was triggered, and various hyperlinks which allow the analyst to view rule documentation, edit the rule directly, disable the rule in the current policy, and disable the rule across all policies. �
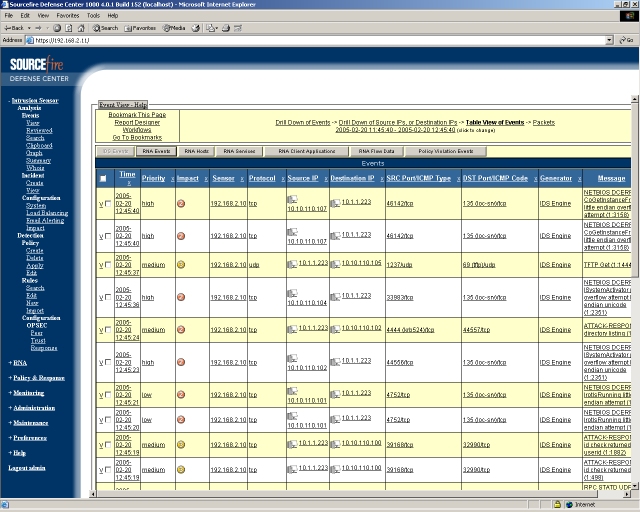
Where RNA Sensors are deployed, hyperlinks are also available to view the Host Profile of the source and destination IP hosts, providing a detailed overview of the host configuration, active services and known vulnerabilities for that host (more on Host Profiles in the RNA section of this report).� From the table view of event details, it is possible for the analyst to further summarise the contents by eliminating one or more columns of data. This has the effect of grouping entries together by the item of data removed, producing new summary counts for each line in the table. For example, from the lowest level detail table, the analyst can click on the Remove button for the Time column which effectively eliminates each individual alert and groups them together by name, providing a total for each alert within the selected time interval. Or he could eliminate the Destination IP address column to provide a grouping and totals by Destination IP.� Another way to drill down is to select an individual piece of data within any of the columns. For example, clicking on a particular Source IP will filter all the data on that item, showing only those entries for that particular Source IP. Clicking on a level 1 entry in the Impact Flag field will show only those alerts with the highest priority Impact Flag - where RNA is used, this is the perfect way to determine which alerts need to be addressed most urgently. Columns can be re-instated at the click of a button, and wherever navigation becomes a little too complicated, the pure Web-based nature of the GUI allows the browser Back button to be used to retrace steps through the displays. � At any point, a particularly interesting view can be bookmarked for use again by the analyst, allowing him to return quickly to a specific location and time in an event analysis. Bookmarks retain information about the following: �
Bookmarks available to all users with unrestricted data access, meaning that should one analyst uncover a set of events that require more in-depth analysis, he can easily create a bookmark and turn over the investigation to another person.�
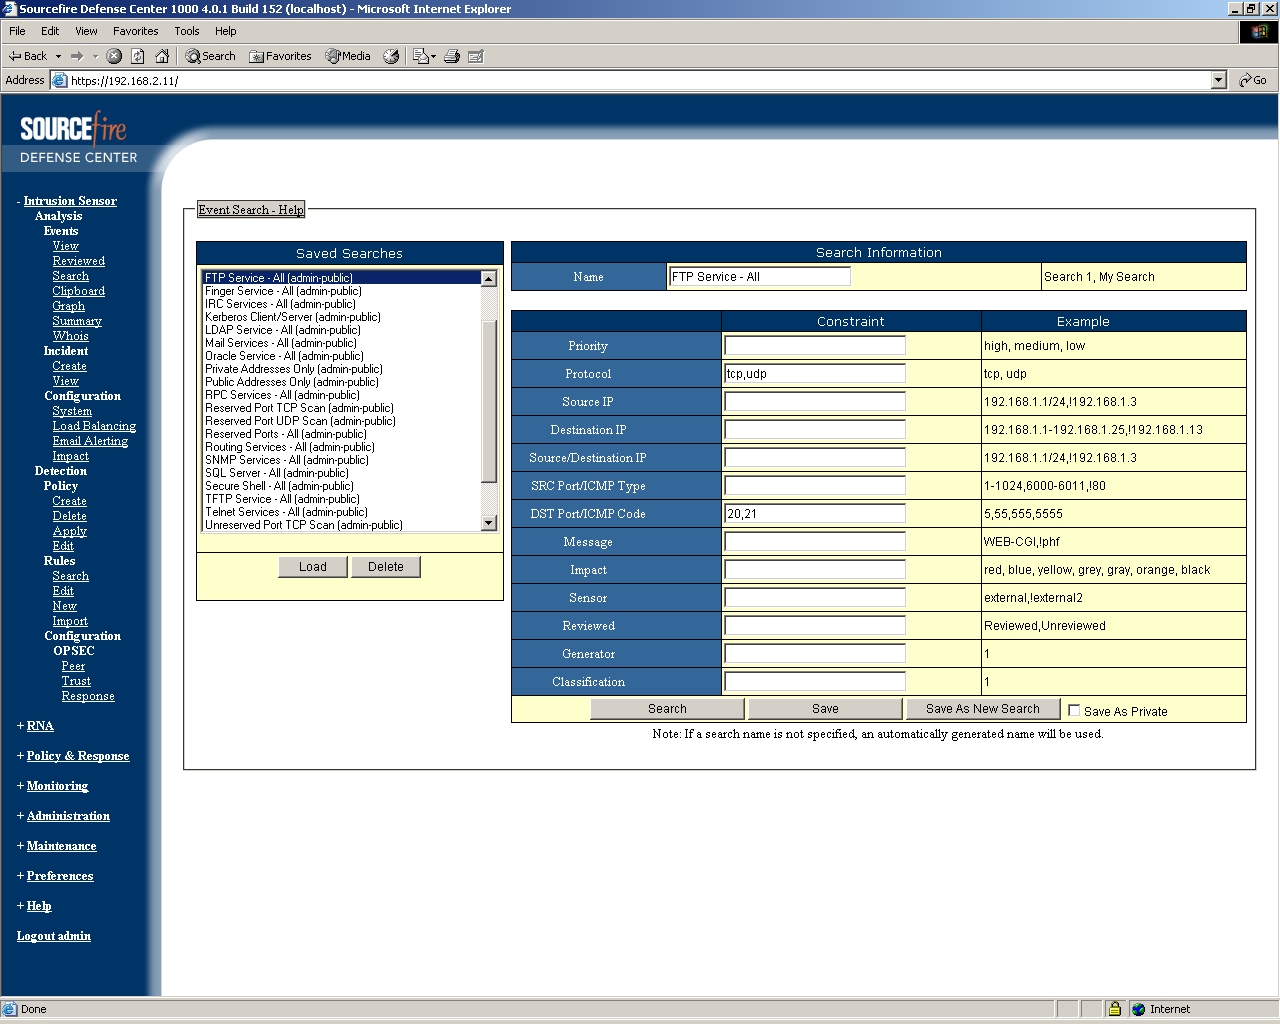
The analyst can also select and copy a range of events to the clipboard. He can generate a report for the events on the clipboard (up to a maximum of 100) just as he would from any of the event views. � In addition to building search criteria on the fly by drilling down into event data, the analyst can also use the Intrusion Event Search Criteria option to build customised search criteria from scratch. He can use a single search criterion like source IP address, or he can combine several criteria to narrow his search results. Commonly used search criteria can be saved to be used again and again without having to re-define the search (custom search criteria are tied to specific user accounts). � The following criteria can be used:
Events which have been examined and determined to be of little or no interest or importance can be marked as Reviewed. Events that are marked as Reviewed remain in the event database, but no longer appear in the event pages or as part of the event summary statistics. It is still possible, however, to examine events that were previously marked as Reviewed, as well as reinstate them to the normal event views by marking them as Unreviewed.�
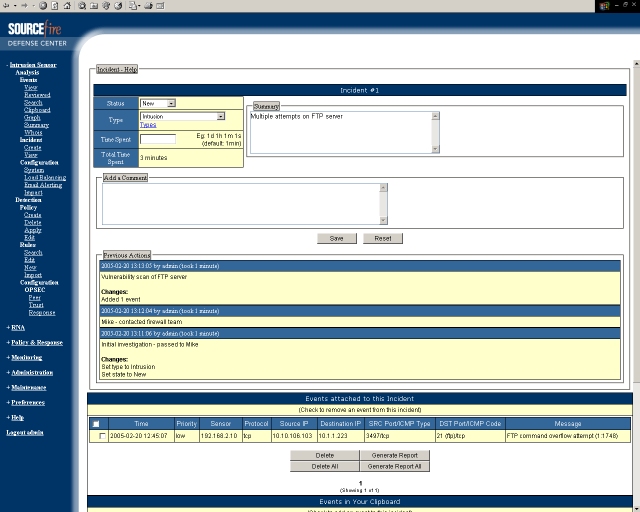
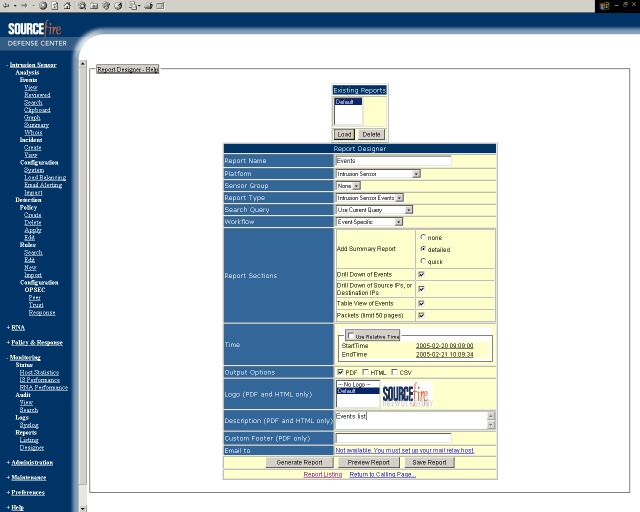
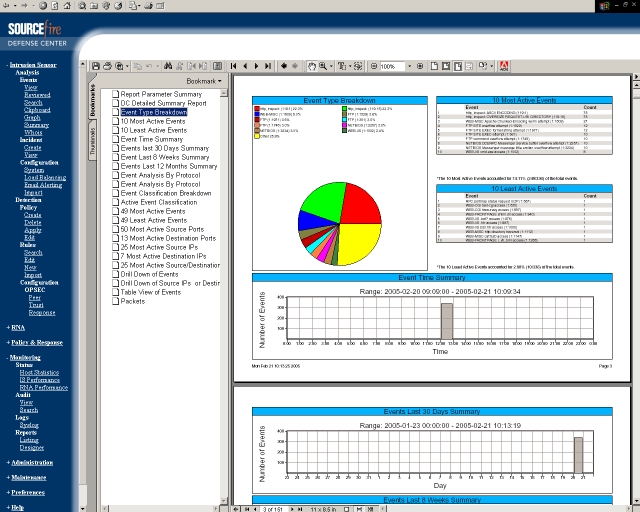
As event analysts review the events and determine whether they are important in the context of their network, separate events (with their associated packet data) can be manually correlated and annotated into Incidents. These Incidents can be monitored, tracked and updated via the Incident Handling menu options. For example, an incident can be used as a repository for notes about any activity that an analyst might take outside of Sourcefire 3D to mitigate the effects of the attack (perhaps noting that the infected hosts have been quarantined, that patches have been applied, and so on). Sourcefire 3D also supports an incident life cycle, allowing analysts to change an incident’s status as they progress through their response to an attack. � The Sourcefire system is geared primarily towards incident handling and forensic analysis, and thus the usual high-level management-oriented graphical reports that can be found in other products have been omitted (trend reporting will be added in a future release).� Instead, Sourcefire 3D provides a flexible reporting system that can be used to generate a variety of event reports showing both intrusion events and audit events. We have already mentioned that reports can be built from the data that appears on one of the event views (a number of pre-defined Workflows provides an easy way to generate reports initially), generating defined reports against any subset of events in an event view or Workflow. The parameters that were used to generate the current list of events are automatically reflected on the Report Designer page, following which they can be modified, if necessary, including the time range for the events included in the report and workflow pages used display the events. The finished report can be formatted as PDF, HTML, or as comma-separated values (CSV).� It is also possible to build a report profile from scratch on the Report Designer page. This can be saved for later use to generate the report on demand, or can be scheduled to run automatically through the scheduling facility. The analyst can define a variety of attributes for any report, including adding a company logo, defining the set of events that appear, and selecting the amount of detail contained in the report. �
Sourcefire 3D provides summary reports (Quick Summary or Detail Summary) for IDS event data which can be appended to any custom report by selecting the appropriate radio button in the report profile. Quick Summary reports can include up to 100 million events, and contain the following: �
Detailed Summary Reports can include up to 250 thousand events and contain the following:
As well as the ability to preview reports on-screen, all reports are saved to the Defense Center system, and the Report page lists the previously generated reports. Each report is listed with the report name as defined in the report profile, plus the date and time the report was generated, and each one can be viewed on demand or downloaded to a local host.� Monitoring system processes, disk space, and performance is an important part of the daily administration of the Intrusion Sensor, and the following monitoring functions are provided:
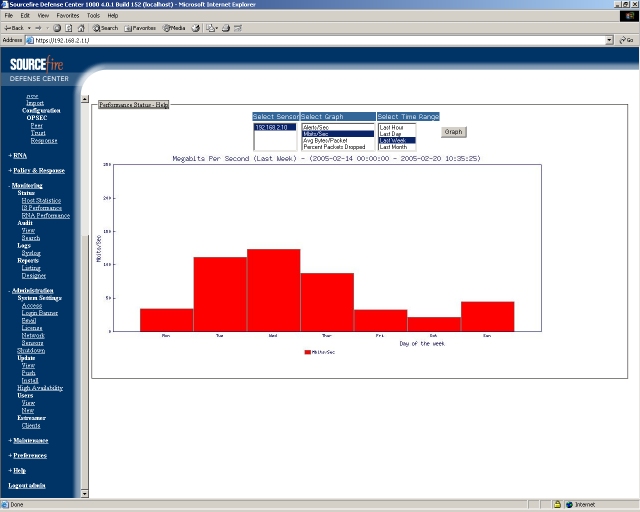
The Intrusion Sensor Performance Statistics page allows the administrator to generate graphs that display performance statistics for the Intrusion Sensor over a specific period of time. Graphs can be generated to display number of alerts per second, number of megabits per second, average number of bytes per packet, and the percent of packets dropped from the system. These graphs can show statistics for the last hour, last day, last week, or last month of operation.�
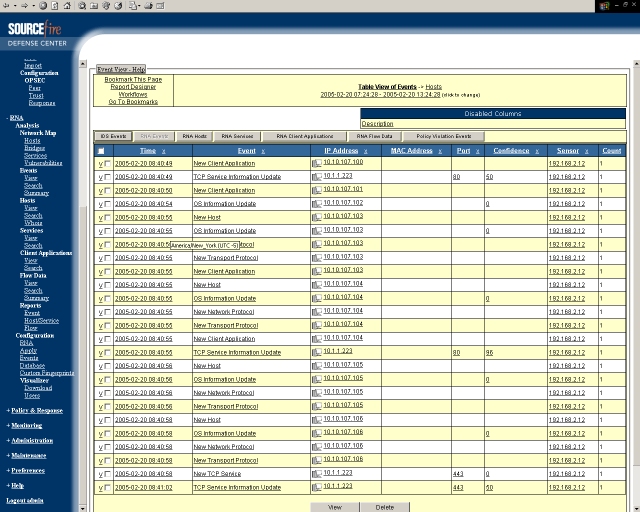
The Intrusion Sensor also logs read-only auditing information for user activity. Audit logs are presented in a standard event view that allows the administrator to view, sort, and constrain on audit log messages based on any item in the audit view. � As with intrusion detection security policies, the administrator can define RNA configuration policies that can be applied to multiple managed RNA Sensors via the Defense Center. These are much more straightforward than Intrusion Detection policies, since they simply define which IP addresses or address ranges should be monitored, and what limits should be placed on the amount of data collected.� Once the policy has been applied, the RNA Sensors passively collect traffic travelling over the network, decoding data and then comparing it to established operating system and service fingerprints. They also collect flow data for all network sessions that involve at least one monitored host. This information is collected in RNA network discovery events that are transmitted to the Defense Center, and all discovered hosts and services reported by the events are mapped into a detailed representation of the network that can be viewed from the Defense Center interface. This is called the Network Map. �
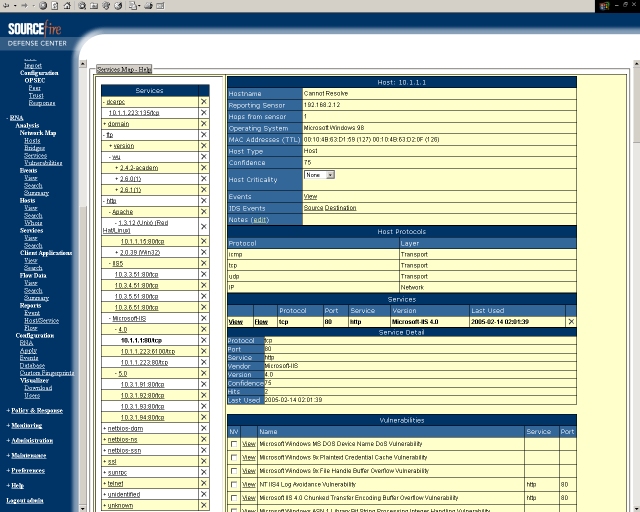
The Network Map allows the analyst to view the network topology in terms of the hosts that reside on the network, the bridges on the network (which may include hubs, routers, or switches), the services running on the network, and the vulnerabilities on the network. � It is possible to delete entire subnets, specific hosts, service categories, specific services, or deactivate vulnerabilities from the network map in order to ignore them or watch for changes at a later date. Deleted services will be re-added to the network map if RNA detects a change in the service (for example, if an Apache web server changes versions). � Deactivated vulnerabilities will be re-activated when the operating system or service mapped to the deactivated vulnerability changes. Deleted hosts will be re-added to the network map if RNA is restarted and it detects host activity again. If there are specific subnets or hosts that should be permanently excluded from the network map, it is possible to exclude the subnet or IP address in the configuration policy for the RNA Sensor. The network map is split into the following components: �
The Defense Center gathers data from all managed RNA Sensors and correlates the data into a composite Network Map. If multiple RNA Sensors generate events for the same host or service, the Defense Center combines the information from each sensor into a composite representation of that host or service.� From the Network Map, the analyst can view a list of hosts detected by RNA, organised by subnet, as well as viewing a detailed host profile for any listed host. Host profiles contain detailed information about hosts, running services, and vulnerabilities for specific hosts, and allow the analyst to modify host criticality, add notes associated with the host, and re-categorise vulnerabilities.�
Each Host Profile contains information such as:�
The analyst can click the View hyperlink next to any service, vulnerability or flow to access more information. � The Bridges view of the Network Map provides a complete view of the network bridges and routers that connect one segment of the network to another. � The Services view of the Network Map provides a complete view of the services running on the network (including unidentified services), the vendor and version of each service, and the hosts running each service. �
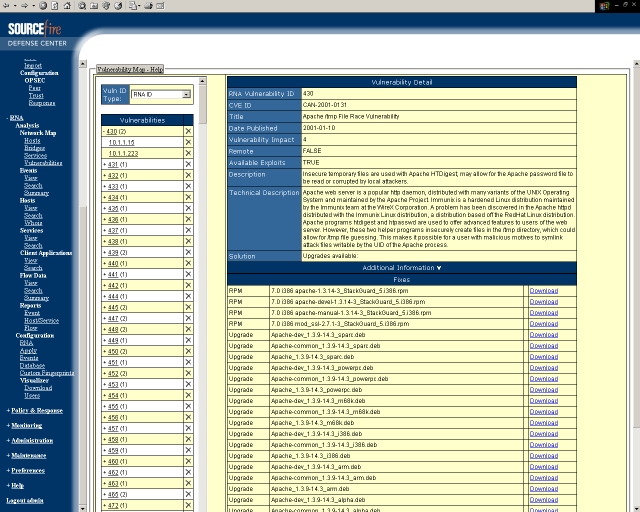
The Vulnerabilities view of the network map provides a view all of the vulnerabilities that RNA has detected on the network, organised by RNA ID, ArachNIDS ID, BugTraq ID, CVE ID, Nessus ID, or Snort ID. The vulnerabilities are arranged by identification number, with affected hosts listed beneath each vulnerability.� From the Vulnerabilities view it is possible to select a specific vulnerability to view its details, or select any host beneath a vulnerability to view the host’s detailed profile, which allows the analyst to better evaluate the threat posed by the vulnerability on a specific affected host. The analyst can also deactivate vulnerabilities from the Network Map, meaning that they will no longer be used for intrusion impact correlation for any hosts that are currently vulnerable. Deactivated vulnerabilities appear in the Not Applicable vulnerability list for affected host profiles and can be re-activated at any time by moving them back into the active vulnerabilities list.� From each different view, the analyst can access the host profile of each host that is detailed within the view, and RNA events can be queried, viewed, bookmarked, copied to clipboard, drilled down via Workflows, and handled in the same way as normal IDS Events RNA is ideal for policy enforcement and change management, since the RNA Sensor generates events that communicate the details of any change in a monitored network segment. New events are generated for newly discovered network assets, and change events for any change in previously identified network assets, � The first time a managed RNA Sensor runs, it generates new events for each host and any TCP or UDP services discovered running on that host. In addition, the RNA Sensor generates new events for each network and transport protocol running on each discovered host. After the initial network mapping is complete, the RNA Sensor continuously records network changes by generating change events. Change events are generated whenever the configuration of a previously discovered host or service changes, thus preventing users from adding unauthorised laptops or Wireless Access Points to a monitored network unnoticed. �
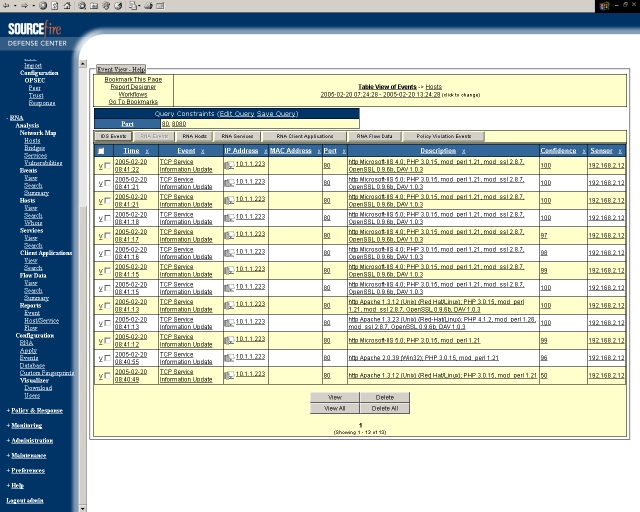
Network discovery events are logged to the Defense Center and are displayed on the RNA Event View page. They are also used within compliance policies and can be configured to trigger syslog, SNMP, and e-mail notifications. � When a monitored host connects to another host, RNA can, in many cases, determine what application was used. RNA detects the use of many mail and web clients including Microsoft Internet Explorer, Microsoft Outlook and Outlook Express, Lotus Notes, Mozilla Thunderbird, Ximian Evolution, and more. For each client application event that is generated, RNA logs the IP address that used the application, the product, the version, and the number of times its use was detected. The analyst can use standard event views to display client application events and can use the search facility to quickly search for specific applications, if necessary. RNA Sensors are also continuously monitoring traffic generated by each host that they are configured to detect. When an RNA Sensor detects that a connection between a monitored host and any other host is terminated, it generates a flow event. Flow events include information about the collected traffic, including the first packet of the transaction, the last packet of the transaction, source IP address and port, destination IP address and port, the number of packets and bytes sent and received by the monitored host, and the client application and URL involved in the transaction, if applicable.�
The analyst can search for flow data specific to a source or destination IP address, port, or protocol, and can create, save, and re-use flow data searches. In addition, RNA provides a number of default flow data searches that serve as examples (they can be duplicated and/or modified) and can provide quick access to important information about the flow data traversing the network. Default searches include:
The Flow Summary page provides a list of the most active hosts on the monitored network segment organised by initiator and responder. Finally, one of the most valuable uses for RNA is to correlate Intrusion Events with RNA data in order to more accurately define the Impact Flag for an Intrusion Event. For example, if the Impact Flag for a particular event is set to level 3 initially, but Defense Center determines from RNA data that the target host is running a service that is vulnerable to the exploit used, the Impact Flag is modified to a higher value accordingly.� However, should an Intrusion Sensor discover an attempted IIS exploit on the wire, but RNA has determined that the target host is a Linux box running Apache, the Impact Flag is lowered. If the target host is not running a Web server at all, the Impact Flag may be lowered even further. �
Thus, RNA adds valuable context to IDS intrusion events based on actual network knowledge, and therefore allows the administrator to prioritise his activities. Where RNA Sensors are running on a network, for example, the administrator can be sure that all alerts with an Impact Flag value of 1 (the highest) should be dealt with immediately, whereas those with a value of 5 can be left for a more leisurely analysis. � When combined with the Host Criticality field in particular, Sourcefire 3D is able to very accurately determine those hosts at the greatest risk. Performance Performance under all but the most extreme load conditions was impeccable, with 100 per cent of all attacks being detected under all load conditions except the 10,000cps and 20,000cps HTTP tests (see Test Results section of this report). In particular, the device turned in a flawless performance in all of our “real world” tests, and we would thus have no problem in rating the Sourcefire IS3000 as a true 1Gbps device under all normal network conditions.� The Sourcefire IS3000 performed consistently and mostly reliably throughout our tests. Exposing the sensor interface to an extended run of ISIC-generated traffic had no adverse effect, and the device continued to detect and log all other exploits throughout and following the ISIC attack. � Overall, performance was excellent under normal network conditions.� Security Effectiveness Signature recognition was acceptable out of the box (79 per cent), and was increased to 91 per cent after the application of a signature pack update which was provided to us in under 48 hours. � The device did show some signs of weakness in our false negative and false positive tests, indicating that some signatures are detecting the exploit rather than the underlying vulnerability. However, it should be noted that recent improvements in the Snort rule “language” and efforts by Sourcefire’s signature-writing team have done a lot to improve this area.� A code update was required to rectify some issues with FTP traffic normalisation, following which the IS3000 collected a clean sheet across the board in our evasion tests. Fragroute, Whisker, ADMmutate, running exploits on non-standard ports and even RPC record fragging all failed to trick Sourcefire into ignoring valid attacks. In addition, all but one of them was decoded accurately. � Out of the box, the Sourcefire IS3000 handled 1 million open connections easily, and the device appeared to be immune to stateless attack replay tools such as Stick and Snot. � Usability Although navigating the Sourcefire 3D Defense Center interface can be daunting initially, once the initial learning curve has been mastered the UI provides one of the most powerful and flexible we have seen - particularly when it comes to forensic analysis and reporting.� The Workflow concept is an excellent idea, allowing the analyst to determine exactly how he would like to process events and drill down to get more detail. At the same time, when at the more detailed levels, the ability to group events by any column of data on the fly allows the analyst to re-summarise the events in almost any way imaginable. At any point during his analysis, he is then able to generate bookmarks that can be shared with others, or custom reports for his own use.� The ability to mark events as reviewed or group them together and annotate them as Incidents adds a further dimension to the Sourcefire 3D system.� Sensor and policy management are also extremely straightforward, and very scalable. Policies can be applied to single or multiple sensors at the click of a mouse, and it is always easy to determine which policies have been modified and need to be re-applied. The “crown jewels” of Sourcefire 3D come in the shape of RNA which provides much needed context to intrusion alerts via the use of extensive passive scanning and vulnerability analysis. This allows Defense Center to accurately determine the impact on a particular host of a particular vulnerability and set the Impact Flag accordingly. This should greatly enhance the analyst’s ability to focus on exactly those alerts which pose the biggest security concerns on his network, and this should go a long way to removing one of the biggest perceived “problems” with IDS systems - analyst overload from too many irrelevant alerts.� Throughout our testing, this feature worked impeccably, and is a very compelling reason on its own to purchase this product.� Company
name: Sourcefire, Inc. Click here to return to the Gigabit IDS Index Section |
Send mail to webmaster
with questions or�
|