|
|
|
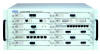
Appendix A - The Test Equipment Spirent Communications SmartBits SMB-6000/SMB-600 Spirent Communications (www.spirentcom.com) provides network and communications testing solutions for developers, manufacturers, evaluators and operators of communications equipment, networks and services. The SmartBits 6000 (and its smaller sibling the SmartBits 600) are multi-port network performance analysis systems designed to measure the performance limits of complex network configurations and network devices.
The SmartBits 6000 is a high port density network performance analysis test system. Each chassis can hold up to 12 SmartModules in various combinations to support up to 48 Gigabit Ethernet ports, 96 10/100 Mbps Ethernet ports, 24 POS (Packet over SONET) ports, 24 SmartMetrics Gigabit ports, or a mixture of these port types. Multiple SmartBits 6000 chassis can also can be daisy-chained together to achieve even higher port densities. The SmartBits 6000 is controlled from a Windows-based PC or a UNIX workstation through a 10/100 Mbps Ethernet connection. Control is via a �soft front panel� SmartWindow application, and the system also includes SmartApplications software, which automates industry standard performance tests as defined in RFC 1242 and RFC 2544. Spirent�s SmartBits SMB-600 chassis is a portable and compact version of the SMB-6000, providing all the same features and holding up to two modules. It can support up to 8 Gigabit Ethernet ports, 16 10/100 Mbps Ethernet ports, 4 POS (Packet over SONET) ports, 4 SmartMetrics Gigabit ports, or a mixture of these port types. Spirent has recently introduced a new generation of SmartBits network and Internet test systems called TeraMetrics. The TeraMetrics open architecture is a foundation for a new family of SmartBits test systems to meet the accelerating demands, complexity, increased speeds and scalability of terabit (up to 10 gigabits per second) switching. The range of SmartBits products also includes a set of software tools that allow SmartBits systems to be used for a variety of applications, ranging from industry standard tests to specific applications for new and emerging Internet and data technologies. Those used extensively within NSS include: SmartWindow � SmartBits virtual front panel. Within SmartWindow, the test engineer simply needs to select a protocol, set class of service parameters, and then test any of the following: NIC cards, servers, bridges, cable modems, xDSL modems, switches, routers, VLANs, firewalls, live networks, or multimedia scenarios. SmartApplications � Provides automated performance analysis for bridges, switches, and routers per RFC 1242 (Benchmarking Terminology for Network Interconnection Devices) and RFC 2544 (Benchmarking Methodology for Network Interconnect Devices). Tests are available for Ethernet, ATM, and Frame Relay.
SmartFlow � Tests line rate QoS. Enables both forwarding and policy tests. Analyses each incoming stream to test a device's (or network's) ability to forward very large numbers of flows. Analyses the device's ability to correctly handle policies implemented in the network or device under test. SmartTCP � Tests load balancer performance. Tests measure the TCP session performance of server load balancer devices that make forwarding decisions based on Layer 4-7 information. SmartTCP benchmarks both the rate and connection capacities of the device under test to establish, maintain, and tear down TCP sessions. WebSuite/Firewall � Designed to simulate real-world traffic loads in order to support the testing of content delivery and network equipment. Gauges the performance of firewall's performing NAT (Network Address Translation). Determines maximum application transaction capacity. Measures application throughput with TCP acting as the transport agent. Evaluates an in-line device�s ability to deal with DoS (Denial of Service) attacks. TeraVPN � Designed to measure the network performance of IP Virtual Private Networks. Determines IP-VPN tunnel creation capacity using IPSec protocols. Also generates UDP or HTTP traffic over each tunnel and measures data performance characteristics like packet loss, latency, and response time.
SmartWindow and SmartFlow are used to generate background traffic for the UDP tests in this report. WebSuite is one of the tools used to generate high-volume DoS attacks. In general, the Spirent software is not particularly easy to use, lacking a consistent look-and-feel across the range making it difficult to switch from one product to another. Not all of the software packages run across all of the SmartModules either, making it difficult to select the exact combination of hardware and software required to perform a range of tests. However, the hardware is solid and reliable, and provides a means to generate high volumes of layer 2/3 traffic up to multi-Gigabit speeds. Spirent Communications Avalanche Whether you are building network equipment or providing a service, you must deliver consistent performance under all conditions. Until now, capacity assessment at high-loads has been a costly and complex process. For this reason Spirent Communications introduced the Avalanche appliance to assist with the challenge. At NSS we have taken a number of these capacity planning products and integrated them into our test-bed to aid in simulating real-life Internet conditions � the sort of conditions that the average user experiences daily. Avalanche is described by Spirent as a capacity assessment product that challenges any computing infrastructure or network device to stand up to the real-world load and complexity of the Internet or intranets. The system generates simulated network traffic that features real-world characteristics such as connection speed, packet loss, browser emulation, user think-time and aborted transactions. This helps provide invaluable information about a site's architectural effectiveness, points of failure, modes of performance degradation, robustness under critical load, and potential performance bottlenecks. Using Avalanche to generate Internet user traffic and the matching Reflector to emulate large clusters of data servers, it is possible to simulate the largest customer environments. Each one sports up to four copper or fibre Gigabit Ethernet ports which are load-balanced equally between dual Intel processors when generating traffic to achieve in excess of 2Gbps traffic per Avalanche / Reflector pair. Between them they can set up, transfer data over, and tear down connections at rates of more than 50,000 requests per second (HTTP 1.0 with no persistence) and over 60,000 requests per second (HTTP 1.1 with persistence). They can sustain over 6,000 HTTPS requests per second with no SSL session ID re-use, generate more than 10,000 streaming requests, and simulate 1.7 million simultaneously connected users with unique IP addresses. All this while handling cookies, IP masquerading for large numbers of addresses, traversing tens of thousands of URLs and operating under a realistic mix of traffic. This allows realistic and accurate capacity assessment of routers, firewalls, in-line security appliances (IDS/IPS/UTM), load-balancing switches, and Web, application, and database servers. It helps identify potential bottlenecks from the router connection all the way to the database, or can simply be used to generate a background test load of realistic traffic. Load can be specified in a number of ways, using user sessions, user sessions per second, transactions, transactions per second, connections or connections per second. Protocols supported include HTTP/1.0, HTTP/1.1 and HTTPS (including persistence and simultaneous connection settings); RTSP/RTP (QuickTime and Real Networks); Microsoft Media Streaming; FTP; SMTP (including attachments) and POP3; DNS; voice (SIP); 802.1Q VLAN tagging; IPSec; PPPoE; and Telnet. It also supports SSL versions V2, V3 and TLS V1, and SSL protocol parameters (version selection, cipher suites and session ID re-use), as well as allowing generation of a range of simulated Distributed Denial of Service (DDoS) attacks and replay of packet capture files.
The system also allows modelling of user behaviour, supporting such actions as use of proxies and proxy caches, use of multiple browser types, multi-level HTTP redirects, user think times, click streams, and HTTP aborts (�click-aways�). Support is provided for dynamic content sites, cookies, session IDs, HTML forms, HTTP posts, and HTTP basic and proxy authentication, and the tester can specify a list of URLs and data object parameters that can be changed on a per-transaction basis. Avalanche includes a high-accuracy delay factor that mimics latencies in users' connections by simulating the long-lived connections that tie up networking resources. Long-lived, slow links can have a completely different effect on performance than a large number of short-lived connections, so this approach provides the ability to finely tune the test scenario for more realistic results. As does the ability to introduce conditions that can seriously affect real-world performance such as packet loss levels, TCP/IP stack characteristics (with control over maximum segment size, slow start/congestion avoidance, VLAN tagging, IP fragmentation, and TCP timeout behaviour) and, of course, line speed. User profiles can be created which enable Avalanche to mix different user types in a single test � perhaps one group of users could be running over a GSM link with high latency and heavy packet loss, whilst another group could be running over a 64K ISDN line, and yet another over a T1 connection. While Avalanche focuses on the client activity, Reflector realistically simulates the behaviour of large Web, application, and data server environments. Combined with Avalanche it therefore provides a total solution for recreating the world's largest server environments. By generating accurate and consistent HTTP responses to Avalanche's high volume of realistic Internet user requests, Reflector tests to capacity any equipment or network connected between the two systems. One of the most useful features of the latest release is the ability to upload custom content which can be used in HTTP requests or as e-mail body/attachments. This allows the tester to create completely real-world traffic by utilising actual Web and mail content rather than the random content generated by the default Avalanche application. In addition, it provides the means to use virus-infected or spam content to more thoroughly test Anti Virus or Anti Spam gateway devices. The ability to replay pre-prepared packet capture files also provides the means to replay exploit traffic at high speeds, in order to more thoroughly test IDS/IPS devices.
The operating system for both units is proprietary � Unix-like in appearance � and is loaded from disk at boot time. Luckily, it is rarely necessary to get to grips with the underlying OS, since all configuration for both Avalanche and Reflector is performed via a Java-based graphical interface called Commander. This interface is new with version 6.5 of Avalanche (NSS currently uses version 6.51), and is a huge improvement over previous releases in terms of usability and speed. The architecture of the product changed too with release 6.5 - the operating system is now identical on both Avalanche and Reflector appliances, allowing each appliance to perform as either a client or a server (but not both at the same time - so you will always need a matched pair). Device ports are allocated within a test specification and the test parameters (including all custom content) are uploaded to the appropriate appliances at the start of each test run. Although making it slower to start a test, this is an extremely flexible feature, since it allows the user to switch the client/server functionality from one side of a Device Under Test (DUT) to the other as required, without having to re-cable everything. All test data and results are now stored on the host PC used for the Commander application rather than on the Avalanche/Reflector appliances. This provides the means to copy and backup tests and results more easily, as well as allowing the user to modify tests off-line without being connected to an Avalanche appliance. Tests are now grouped together as Projects, and each Project shares common content, subnet, user profile and server profile information, allowing re-use where required. By creating new Projects, however, it is a simple matter to ensure that there are no clashes in content, subnet address ranges, and so on.
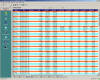
Tests can be copied within Projects but not, unfortunately, between them (which is a shame). Projects can be exported and imported (either an entire Project or selected Tests within it), providing the means to backup, restore, or duplicate Projects. All in all, test management is a huge improvement over previous versions. An Avalanche Test consists of a sequence of phases, each of which are defined in the Test Specification. The Test Specification for the client-side consists of several sub-categories, including Load Profiles, Actions, Network Profiles Subnets, PPP, PPOE, PORTS and Associations. Each of these are configured via a number of tabs along the top of the screen, and where applicable, these tabs are duplicated for the server-side as well. Thus, all the old Avalanche (client) and Reflector (server) parameters are configured from the same place. The Load Profile settings control how traffic is generated during a test. This tab allows the user to configure the required bandwidth, or number of simulated users, connections or transactions initiated (per millisecond, second, minute or hour), along with the maximum number of active simultaneous user sessions, and the duration of each phase. The Actions tab is where the user specifies exactly what will happen during the Test - HTTP GETs, SMTP transfers, DNS requests, and so on. The �language� used to define these actions is fairly straightforward, but is getting more extensive and sophisticated with each release. The use of assigned variables and content taken from lists allows the user to dynamically alter the actions throughout the test, making for a much more realistic traffic mix. The ability to �match� returned content against variables also allows analysis of that content during the test which can be reported via the URL Analyzer utility. For example, NSS uses this to check for when virus-infected content from the server has been replaced by harmless content and a warning message by the DUT, thus ensuring that viruses have been detected and eliminated. The Profile tab allows the user to create individual user profiles, specifying user actions, such as the period of time for which they view a Web page (think time), how often the abandon a slow-loading page (click-away), browser type, SSL configuration, protocol used, and so on. Multiple user and server profiles can be used throughout a test. The Network and Subnets tabs configures proxy parameters, low-level TCP parameters (MSS, fragmentation, receive window, etc.), address ranges, routing information, and even emulated line speed and packet loss for added realism. Ports describes the physical ports to be used in the Test, and one of the great features of the recent release is the ability to use multiple ports distributed across multiple Avalanche appliances, and have Commander automatically distribute the load across those ports throughout the test. This makes Avalanche extremely scalable. The final tab is Associations, and this enables to user to pull together all of the various profiles and actions and networks and ports, and combine them into a single Test. Each Association can be given a different weighting, and traffic is generated according to that weighting. So, for example, it is a simple matter to have 90 per cent of the HTTP traffic from a particular network to be valid requests, and 10 per cent of the traffic to be infected with virus content. This can be used to simulate a wide variety of user behaviour, as well as to combine different protocols and DDOS attacks within the same Test, but running on different ports. Test Specifications are complex things to create, though there is extensive assistance available in the form of context sensitive help in Commander, extremely useful Wizards to step you through the process, and good documentation. Once the tests are running, there is an excellent real-time display available at the Commander console which provides detailed information on the progress of the test, transactions, network traffic, sessions, response times and use of resources. As each test is completed, results are written to a several CSV files on the local hard drive of the PC hosting Commander, and the Avalanche Analyzer utility is now fully integrated into the Commander interface. This provides extensive graphical analysis tools in a single utility, together with the ability to compare multiple Test runs on a single set of graphs. Custom graphs can be created and easily exported, and the print option provides the user with excellent finished reports. The Spirent Avalanche/Reflector equipment is one of only a handful of devices capable of performing this type of �real world� testing concentrating on layer 4 to 7, and this type of test tool is essential when attempting to replicate high levels of real-life background traffic in order to adequately test today�s sophisticated network security products. The operation of the GUI has improved significantly from release to release, and each new release provides a significant increase in speed of response making the user experience much more enjoyable - the new Commander utility provides the most flexible, yet easy to use, incarnation of the software to date. The new hardware platform of the Avalanche appliances also provides a welcome increase in traffic generation performance. The ability to generate over 2Gbps of traffic and almost 2 million simultaneous users in a single chassis (or two if you want to make use of the matched Reflector unit) makes Avalanche an essential and permanent part of our standard test rig. The AX/4000 (also from Spirent Communications) is a modular, multi-port system that can currently test four different transmission technologies (IP, ATM, Ethernet, and Frame Relay) simultaneously at speeds of up to 10 Gbps. Unlike software-based testing solutions, the AX/4000�s FPGA hardware-based architecture is fast enough to provide more than one million full-rate measurements and statistics continuously and in real time.
The AX/4000 Generator and Generator/Analyser modules include tools for creating unlimited traffic variations and detail. Set-up �wizards� and logical functional blocks allow you to build complex traffic streams quickly and easily. When injected onto the network, these traffic streams can be �shaped� (to simulate constant or bursty traffic) and even introduce error conditions. The controller software, available in both Windows and UNIX versions, has a very intuitive graphical user interface. Test set-up is logical and quick and when tests are running, the software displays real-time data and statistics that are thorough and easy to understand. With an Ethernet control module installed in the AX/4000 chassis, the system can be connected to an Ethernet-based LAN for access by remote users. Because every test module in the chassis has its own address on the network, users can access the modules they need and leave the remainder for others to use. This enables multiple users to access the same chassis simultaneously across a network. The AX/4000 is available with a 16-slot mainframe or a four-slot portable chassis. Both are functionally identical except for the number of available slots, and all AX/4000 components will operate in either chassis. Spirent currently produces a range of different test modules to support different test requirements and speeds, including ATM, Frame Relay, Ethernet, and IP. The AX/4000 uses plug-in port interfaces to provide the physical interface for test modules, and these cards are interchangeable allowing a single test module to perform tests with a variety of physical connections and speeds. Despite the advanced traffic generation capabilities, it is for its high-speed packet capture and network monitoring capabilities that the AX/4000 (with both fibre Gigabit and copper 10/100 ports) finds itself in the NSS test rig. In addition to providing live statistics, the analyser can also capture traffic at full wire-rate for further analysis or protocol decoding. Captures can be triggered manually or automatically based on specific events or errors and can include packets or cells received before, after, or both before and after the trigger event. The AX/4000 can maintain over 125,000 simultaneous QoS measurements per port at full rate and in real time. All statistics can be saved on disk for further analysis and for printing detailed test reports. Cisco Catalyst 6500 Series Switches Cisco describes the Cisco Catalyst 6500 Series Switch as its premier intelligent multilayer modular switch, designed to deliver secure, converged services from the wiring closet to the core, and from the data centre, to the WAN edge. Depending on the model chosen, the 6500 Series chassis can support up to 576 10/100/1000-Mbps or 1152 10/100-Mbps Ethernet ports. High capacity network cores support multiple Gigabit and 10-Gbps trunks, and 400 million packets per second (mpps).
Operational consistency is provided by 3-, 6-, 9-, and 13-slot chassis configurations sharing a common set of modules, Cisco IOS Software, Cisco Catalyst Operating System Software, and network management tools. The Catalyst 6500 Series product portfolio includes:
Network security is provided by integrating existing Cisco security solutions, including intrusion detection, firewall, VPN, and Secure Sockets Layer (SSL) into existing networks. It is worth noting that, despite the multi-Gigabit throughput claims for this device, careful choice of blades and supervisor modules is required in order to realise these claims. For example, the 6148 cards provide 48 copper Gigabit ports, but there are only six buffer groups with 8 ports in each group, giving a 6Gbps limit on this card no matter how many ports are used. Stepping up to the 6748 cards, however, provides individual port buffers, thus providing a possible 48Gbps per card, although the total bandwidth from the 6748 cards to the backplane is limited to 40Gbps. Likewise, the SUP2 Supervisor module offers a much lower throughput in terms of packets per second across the backplane than the SUP720, which provides up to 30 million packets per second throughput. Mixing cards and Supervisor modules should also be done with care - adding a 6148 card to a chassis with a SUP720 effectively reduces the throughput to 15 million packets per second. Capacity planning should be performed with care. The current NSS configuration utilises multiple 6506 chassis with SUP720 Supervisor cards, multiple 6748 line cards (for copper connections), 6516 cards (for fibre connections) and dual 3000W power supplies per-chassis, to provide a maximum throughput of 30 million pps and 40Gbps across the backplane of each switch. Click here to return to the UTM Index Section |
Security Testing |
Send mail to webmaster
with questions or
|